

What Are Flag Chart Patterns in Crypto Technical Analysis?
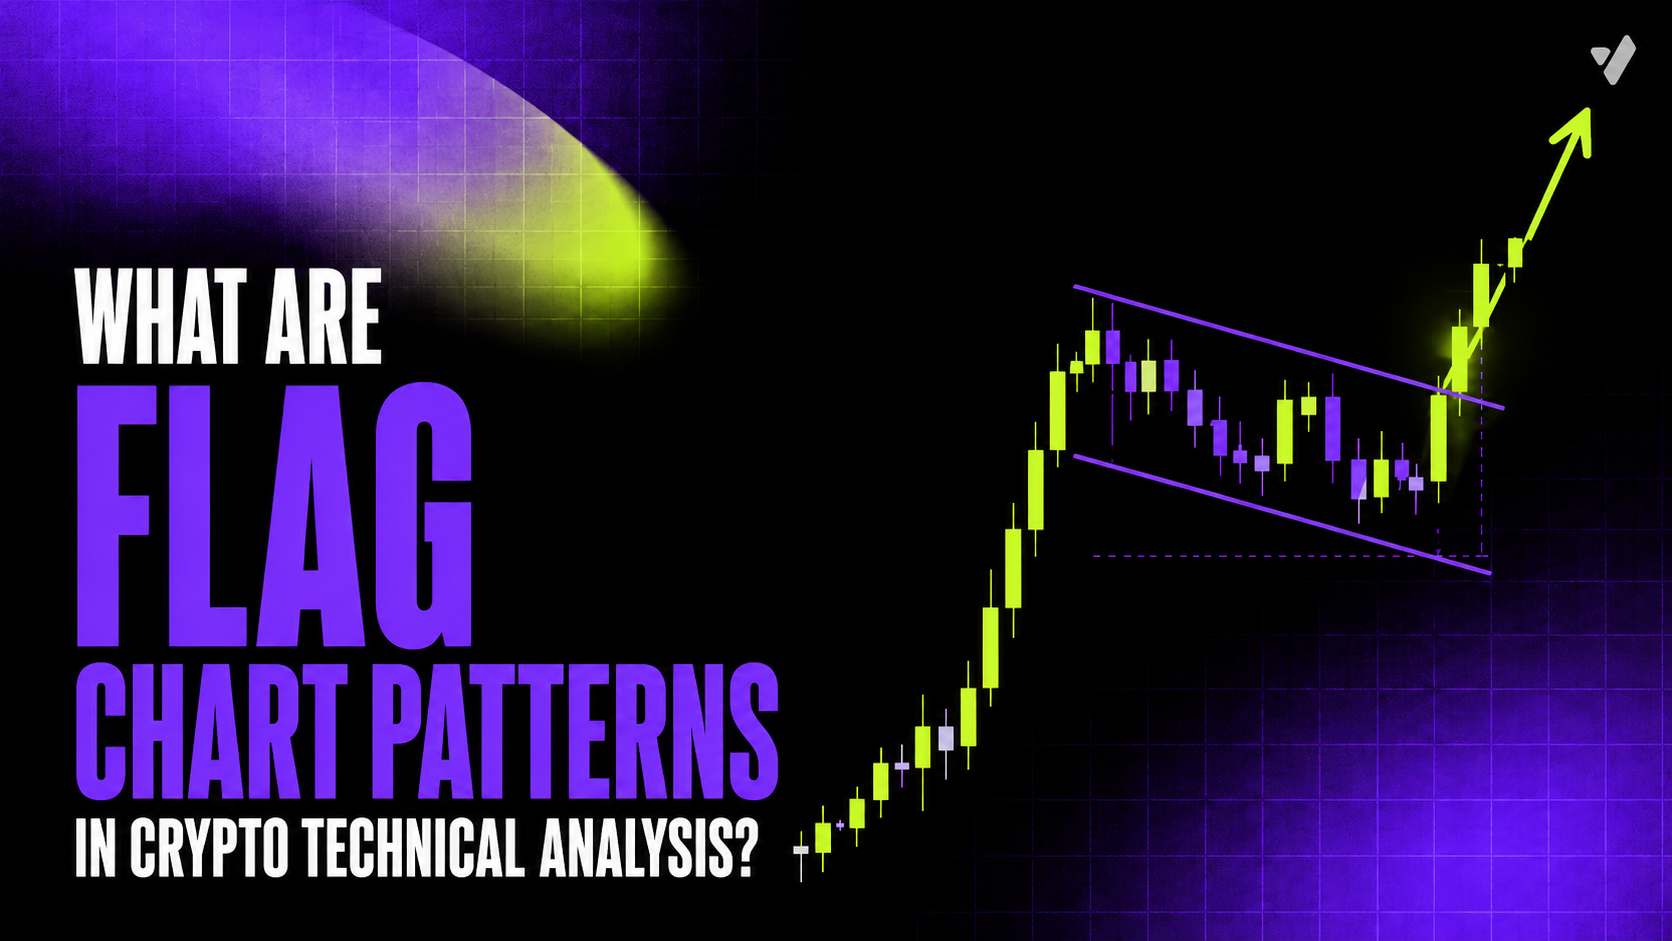
A flag consists of a sharp move called the flagpole and a short consolidation called the flag. A bull flag follows an upward impulse and usually slopes slightly downward; a bear flag follows a sharp decline and often slopes upward. Confirmation appears only after price breaks the flag in the earlier direction. A useful setup needs sufficient volume, a clear invalidation point, and a target that justifies the potential loss.
Table of Contents
What Is a Flag Pattern?
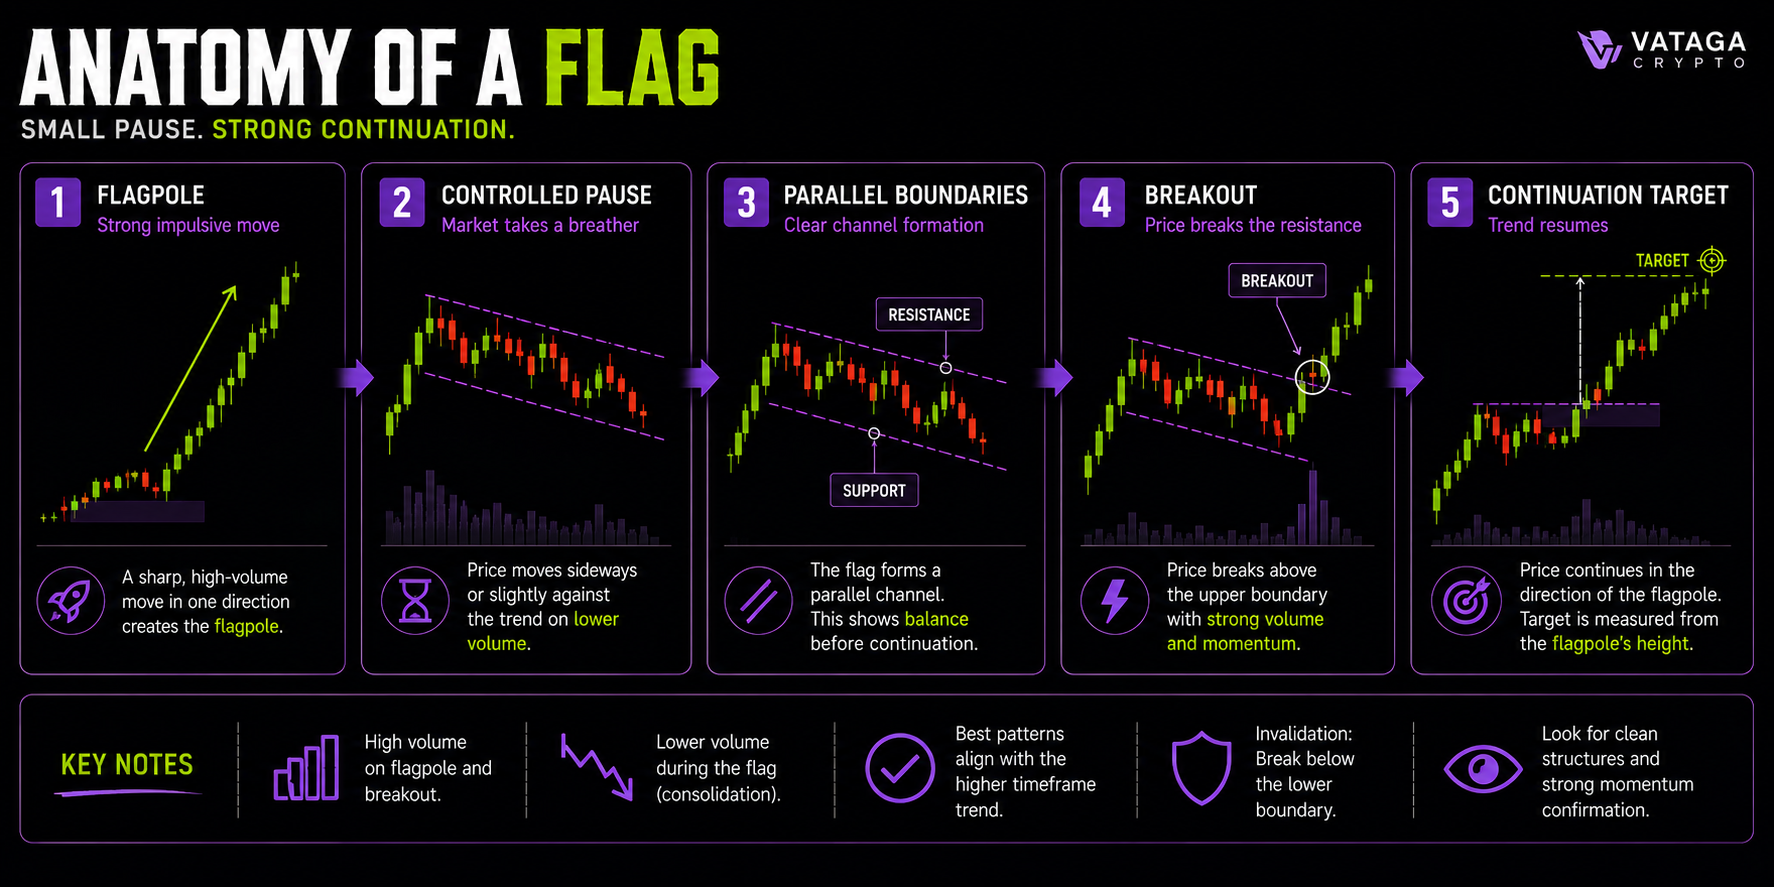
In technical analysis flag patterns are compact continuation structures that appear after rapid price movement. The first move creates the flagpole. Price then pauses inside a narrow range, usually bounded by two roughly parallel lines. If the market breaks out in the direction of the original move, the trend may continue.
The pattern reflects market behavior rather than shape alone. During the pole, one side acts with strong momentum. During the pause, opposing traders respond and early participants close part of their positions. If the correction remains controlled, the original side may regain control.
A flag differs from a broad range because it typically follows a sharp impulse, lasts for a relatively short period, and retraces only part of the pole. OANDA and Investopedia describe flags as pauses within an existing trend before a potential continuation.
Bull Flag and Bear Flag
| Pattern | Prior Move | Typical Flag Direction | Confirmation |
|---|---|---|---|
| Bull flag | Sharp upward move. | Sideways or slightly downward. | Break above the upper boundary. |
| Bear flag | Sharp downward move. | Sideways or slightly upward. | Break below the lower boundary. |
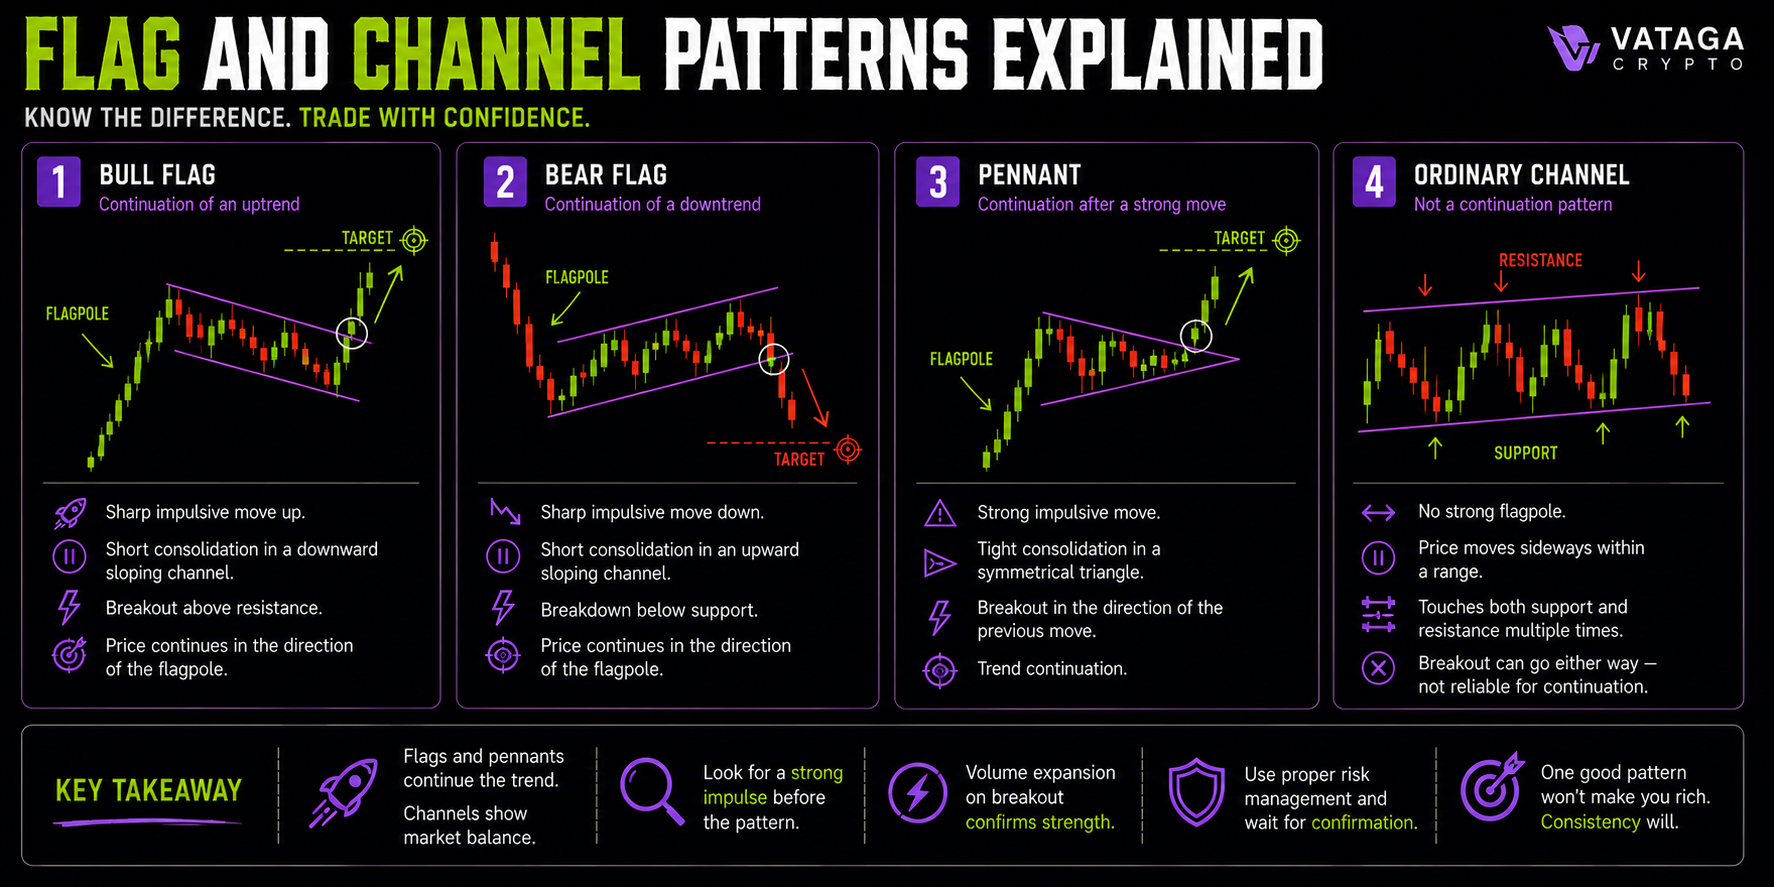
A bull flag begins with strong buying. The following pullback is usually smaller and slower than the pole. Lower volume during the pause may show that selling pressure is limited. The setup is confirmed when buyers push price above the upper line.
A bearish flag is the opposite. Sellers create a fast decline, after which price rebounds inside a compact upward or horizontal channel. The rebound should look corrective rather than like a new uptrend. Confirmation appears when price breaks below the lower boundary.
In technical analysis flag patterns must be read in relation to the prior trend. A downward-sloping channel is not automatically bullish, and an upward-sloping channel is not automatically bearish. Without a clear pole, the structure may simply be a channel.
Characteristics of a Strong Flag
A strong setup usually has five features. The flagpole is sharp and directional. The flag is compact, with smaller candles and a narrower range. Its boundaries are reasonably parallel. The correction retraces only a limited part of the pole. Finally, the breakout shows renewed commitment in the original direction.
| Feature | Stronger Setup | Warning Sign |
|---|---|---|
| Flagpole | Fast, clear, supported by activity. | Slow or irregular move. |
| Consolidation | Small candles and narrow range. | Wide, chaotic swings. |
| Retracement | Limited. | Deep move against the trend. |
| Duration | Brief pause. | Long structure with fading relevance. |
| Breakout | Close outside with follow-through. | Wick outside and immediate return. |
These characteristics help identify technical analysis flag patterns without forcing a setup onto every short channel.
Why Volume Matters
A common sequence begins with higher volume during the pole, lower activity during consolidation, and a new increase on the breakout. Confidence usually increases when activity returns with the break. This suggests that the pause involved less aggressive opposition than the initial move. Investopedia notes that volume often declines during the flag and recovers as price breaks from it.
The rule is not absolute. Crypto data can differ between platforms, and thin markets may show misleading spikes. Compare current activity with the recent average for the same asset and period.
How to Draw the Pattern
Start with the pole. Mark the beginning of the sharp move and the point where momentum paused. Then connect the main highs and lows of the consolidation. The upper and lower lines should contain most of the chart action and remain roughly parallel.
Do not redraw the boundaries repeatedly to create a desired signal. If the lines must move after every candle, the pattern is unclear. The best technical analysis flag patterns have a key break level that multiple traders can identify.
Entry Strategies
Entry Strategy 1: Breakout
The breakout strategy enters when price moves beyond the flag boundary in the direction of the pole. A long entry follows a bull flag break; a short entry follows a bear flag break.
Look for a candle close, stronger volume, or quick execution through the level. Entering on the first small wick creates more false signals.
This technical analysis flag patterns approach captures the move earlier, but the stop may need to sit beyond the opposite side of the flag. If the range is wide, reduce the position to keep financial risk constant.
Entry Strategy 2: Breakout and Retest
A conservative strategy waits for price to break the flag and return to the boundary. In a bull setup, former resistance should act as support. In a bear setup, former support should become resistance.
The retest offers a clearer entry point and may help traders avoid a false break. However, strong moves will not always return. Price should reject the boundary and continue in the original direction. If it closes back inside the range, the signal has weakened.
Stop-Loss and Position Size
A stop belongs where the pattern is invalid. For a bull flag, this may be below the lower boundary or the latest important low. For a bear flag, it may be above the upper boundary or recent high.
A very tight stop can be triggered by normal volatility. A wider stop offers more room but requires a smaller position. Calculate size before entry:
Position size = acceptable account risk ÷ distance from entry to stop
A reliable strategy limits losses so that one failed trade does not significantly damage the account.
How to Set a Target
The traditional target measures the pole and projects that distance from the breakout point. If a coin rises from 100 to 110 and then forms a flag, the pole is 10 points. A break at 108 creates a theoretical target near 118.
This is a reference, not a guarantee. Support, resistance, liquidity, and broader market direction may stop price earlier.
The target should be compared with the stop. If the likely reward is too small relative to potential loss, the trade may not be appropriate.
Flag Versus Similar Structures
| Structure | Boundaries | Sharp Prior Move Required? | Typical Meaning |
|---|---|---|---|
| Flag | Parallel. | Yes. | Continuation. |
| Pennant | Converging. | Yes. | Continuation. |
| Channel | Parallel. | No. | Trend or range. |
| Rectangle | Horizontal. | No. | Continuation or reversal. |
A pennant has converging lines, while a flag uses parallel boundaries. A channel may continue for a long period and does not need a sharp pole. A rectangle can form without a clear prior move and may break in either direction.
Recognizing these differences prevents technical analysis flag patterns from being applied to every consolidation.
Crypto-Specific Considerations
Crypto markets remain open continuously, so liquidity and pattern quality change during different hours and weekends. Bitcoin often affects altcoins: a bullish setup in a small coin can fail when BTC breaks support.
Perpetual futures add leverage, funding, liquidation, and mark-price risk. The stop, not the leverage setting, should define the loss.
News can produce sharp moves and rapid changes in volume. A flag formed around an event may break quickly in the opposite direction. Traders should check the broader environment before they enter.
False Flags and Failed Breakouts
A false flag often begins with a weak pole or a correction that retraces too much, making continuation less likely. The breakout may occur on low activity, meet nearby resistance, and return inside the structure.
Another failure appears when the trend is exhausted. A bull flag after a prolonged rise may become distribution, while a bear flag after a deep decline may lead to reversal.
In technical analysis flag patterns are scenarios, not guarantees. Useful warning signs include a deep pullback, widening range, repeated failed breaks, declining momentum, and strong movement opposite to the pole.
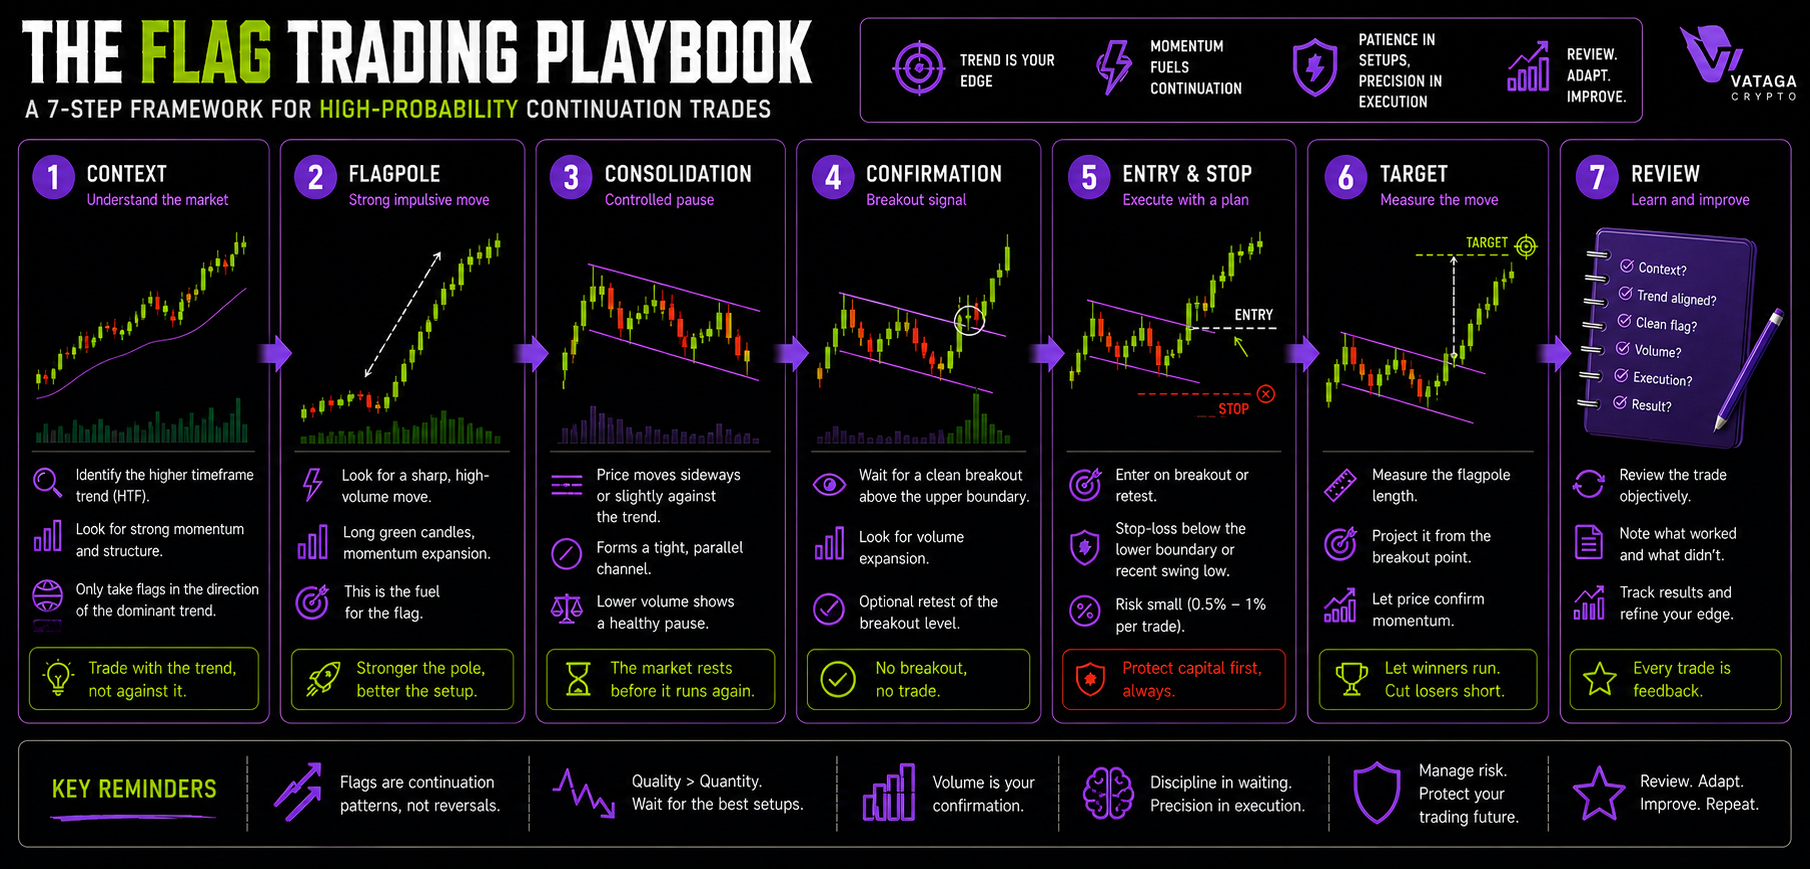
Practical Workflow
| Stage | Action | Decision |
|---|---|---|
| Context | Confirm trend and broader direction. | Does continuation make sense? |
| Pole | Identify a sharp impulse. | Was there real momentum? |
| Flag | Draw parallel boundaries. | Is the pause compact? |
| Confirmation | Check close, volume, and liquidity. | Did the original side regain control? |
| Risk | Place stop and calculate position. | Is the loss acceptable? |
| Target | Project the pole and check nearby levels. | Is the reward sufficient? |
| Review | Save the chart and record the result. | Were rules followed? |
This technical analysis flag patterns checklist works well for trading because it links the trending context, confirmation, and risk instead of relying on indicators alone.
Common Mistakes
The first mistake is entering before the break. A compact pullback can continue against the pole or become a reversal. The second is forcing lines around random candles. If the flag is not clear, other traders are less likely to react to the same boundaries.
The third is ignoring costs. Short targets can be reduced by fees, spreads, and slippage, especially in lower-volume markets. The fourth is using the same position for every setup even when stop distance changes.
The final mistake is reviewing only profitable trades. Failed patterns show which market characteristics reduce performance and help improve future strategies.
How to Practice
Choose one liquid crypto pair and one time frame. Mark every clear pole and consolidation on historical charts without looking at future candles. Record the boundaries, expected break, stop, and target.
Then reveal the next candles and classify the result: successful continuation, false break, or no entry. After collecting enough examples, test one strategy with fixed risk. Track win rate, average gain, average loss, costs, and rule compliance.
The goal is not to prove that flags always work. It is to understand when they offer potential and when the setup should be avoided.
Conclusion
Technical analysis flag patterns describe a sharp move followed by a controlled pause. A bull flag suggests possible upward continuation, while a bear flag suggests that a downtrend may resume.
In practice, technical analysis flag patterns work best when the strongest setups combine a clear pole, compact parallel consolidation, limited retracement, renewed volume, and a confirmed break. Entry can occur on the breakout or the retest.
No flag will be completely reliable. Traders should identify invalidation, calculate position size, compare the target with nearby levels, and close the position when the scenario fails. Used this way, the pattern helps organize decisions without pretending to predict every market move.