

What Are Candlestick Chart Patterns in Crypto Technical Analysis?
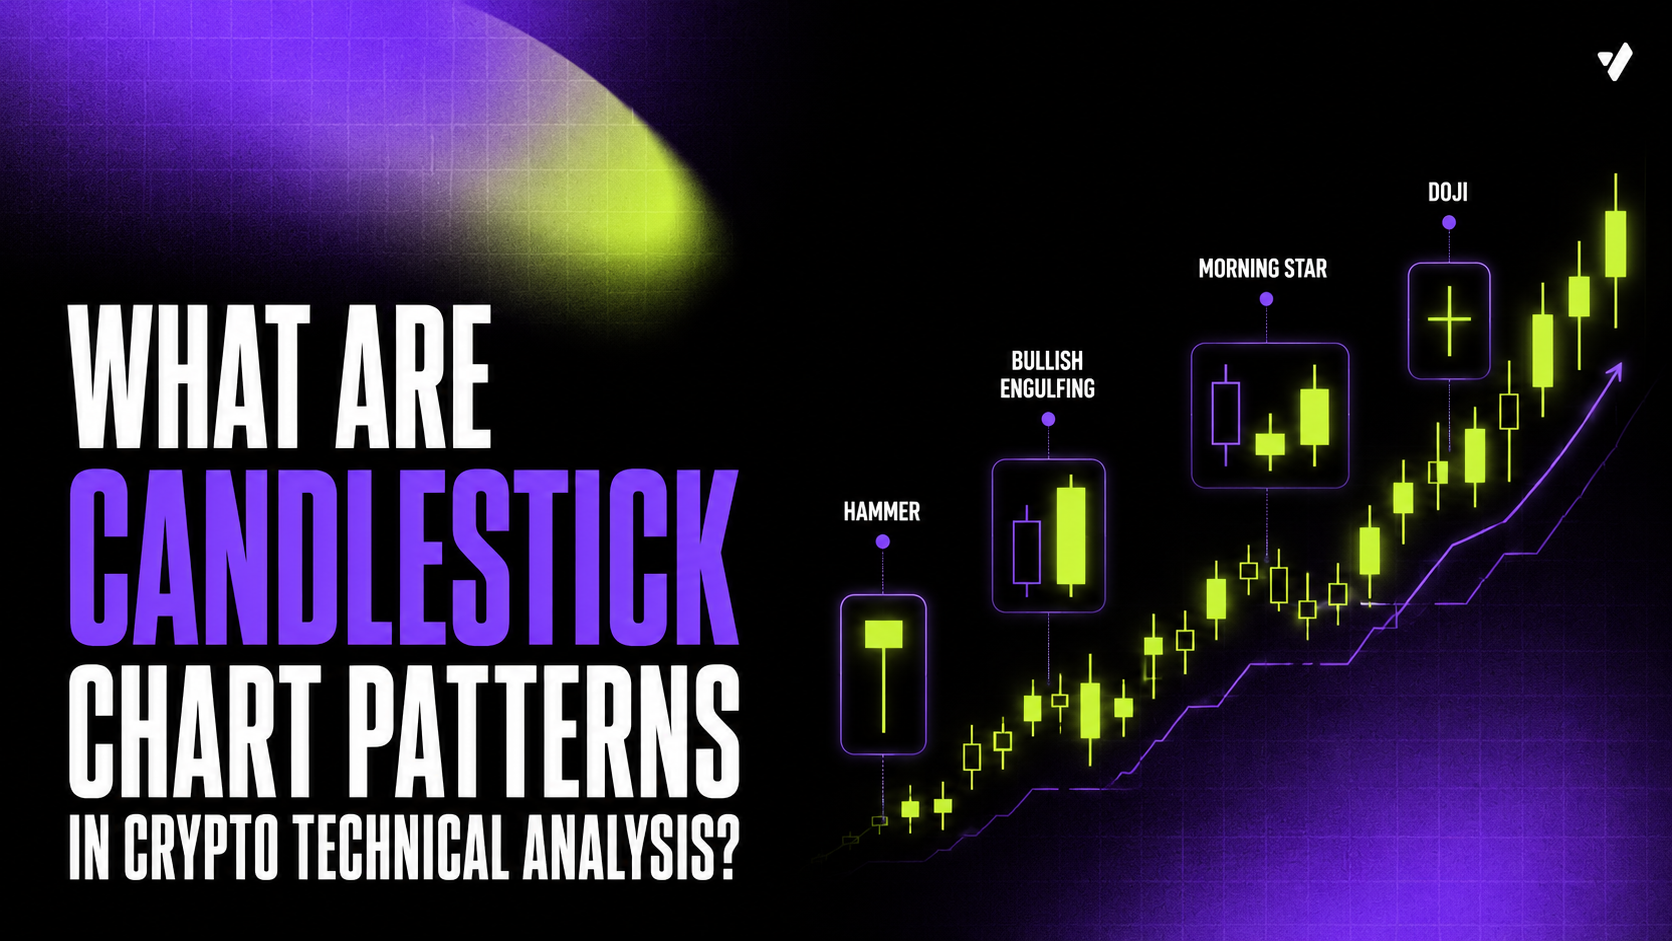
Candles represent the open, high, low, and close for a selected period. A long body indicates decisive movement, while long shadows show rejection or volatility. Reversal formations such as a hammer, engulfing pattern, morning star, or evening star need confirmation from the next candle, a key level, volume, or broader trend. Continuation formations show that a pause may end in the existing direction. In crypto, liquidity, Bitcoin’s movement, perpetual-futures data, and sudden news can change the result, so every setup needs a stop and predefined financial risk.
Table of Contents
How a Candlestick Is Built
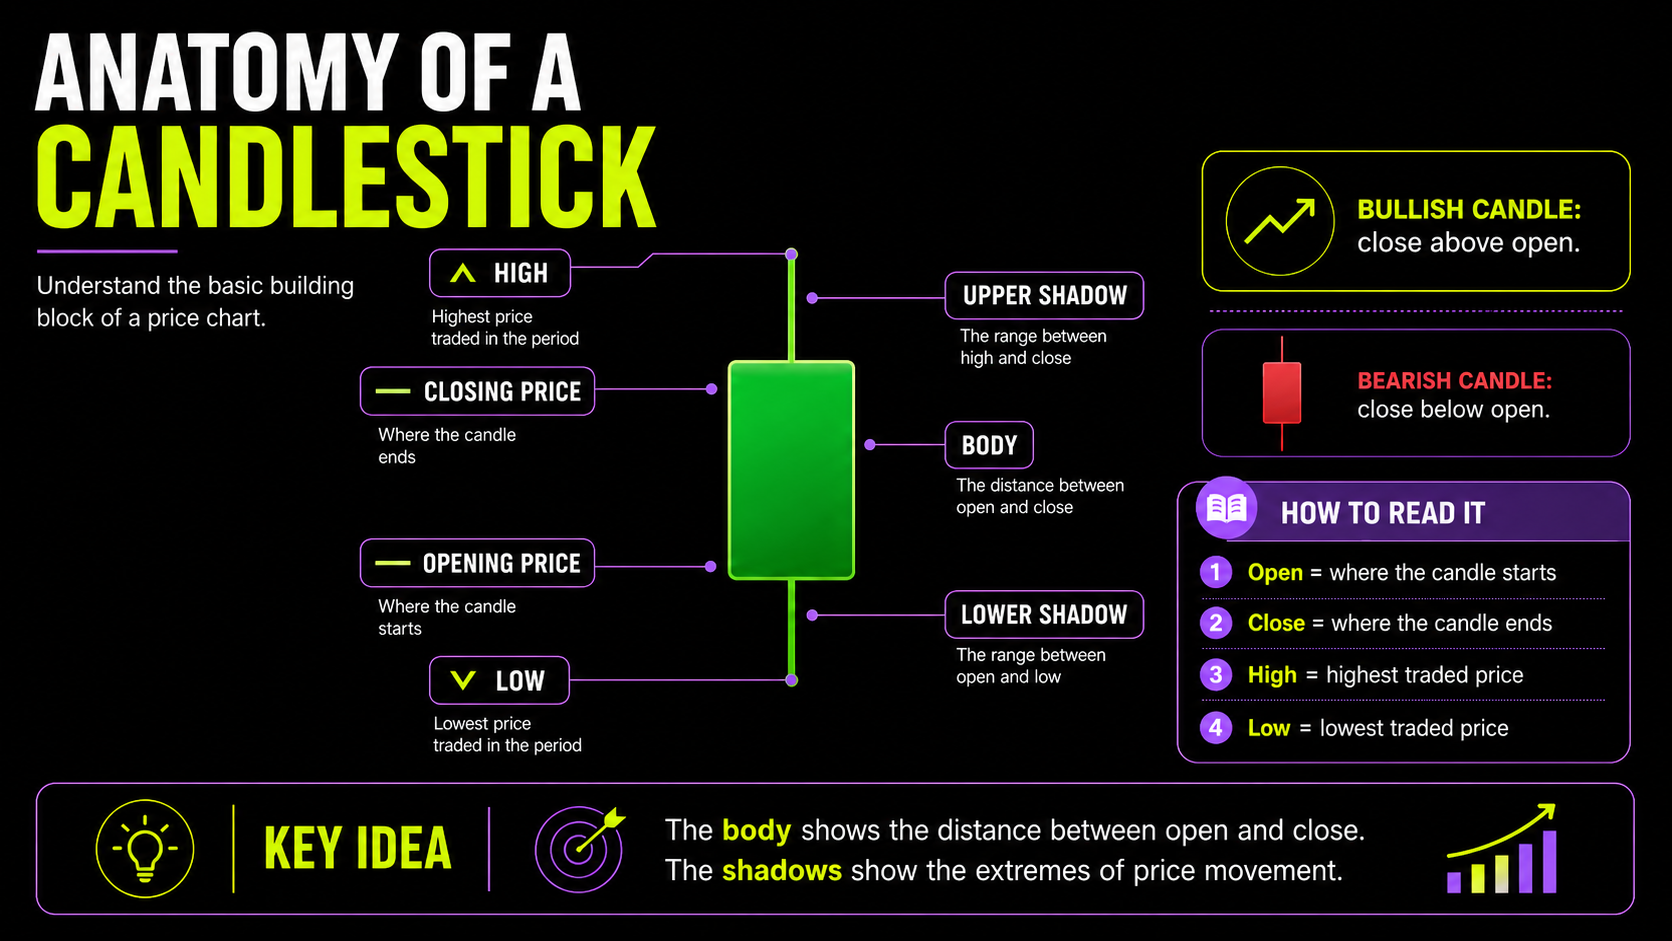
Candlestick patterns in technical analysis begin with four values: the opening price, closing price, high, and low. The body represents the difference between open and close. The upper and lower shadows show the extremes reached during the period. A green candle generally closes above its open; a red candle closes below it. Platforms may use different colors, but the logic is the same.
A large body shows strong directional action. A long upper shadow means price moved higher and then retreated. A long lower shadow means sellers pushed downward before buyers recovered the move. A small body with shadows on both sides suggests hesitation.
Time frame changes the meaning of the data. A five-minute candle summarizes five minutes of trades, while a one-day candle contains an entire day. Higher-time-frame formations often represent more activity, but they also create wider stops. Choose the period before reading the setup instead of switching charts until a desirable signal appears.
Why Context Matters More Than the Name
Candlestick patterns in technical analysis describe the result of a struggle between buyers and sellers. Their meaning depends on location. A hammer after a downtrend at support can indicate rejection of lower prices. The same shape in the middle of a random range may mean little.
Before acting, read the trend, nearby levels, recent volatility, and the distance to the next obstacle. A bullish reversal directly below resistance has limited potential. A bearish signal above strong support may fail because sellers have little space to continue.
Volume can help. A rejection candle with increased activity may show that more participants were involved. However, crypto volume is split across multiple markets, so one platform does not represent the whole ecosystem.
Technical analysis candlestick patterns should therefore be treated as structured observations, not automatic commands. The pattern shows a possible change in sentiment; later price action decides whether that change is real.
Common Candlestick Patterns Technical Analysis: Single-Candle Setups
Single-candle types are easy to identify, but one period provides limited evidence, so confirmation is crucial.
| Pattern | Context | Meaning | Confirmation |
|---|---|---|---|
| Hammer | Bottom of a downtrend. | Lower prices were rejected. | Break above the candle high. |
| Inverted hammer | Bottom or support. | Buyers attempted a reversal. | Strong close above the formation. |
| Shooting star | Top of an uptrend. | Higher prices were rejected. | Move below the candle low. |
| Hanging man | After an advance. | Selling appeared during the period. | Bearish follow-through. |
| Doji | Trend extreme or key level. | Open and close are almost equal. | Next candle defines direction. |
| Spinning top | Any market phase. | Neither side kept control. | Break from the local range. |
Hammer, Inverted Hammer, and Shooting Star
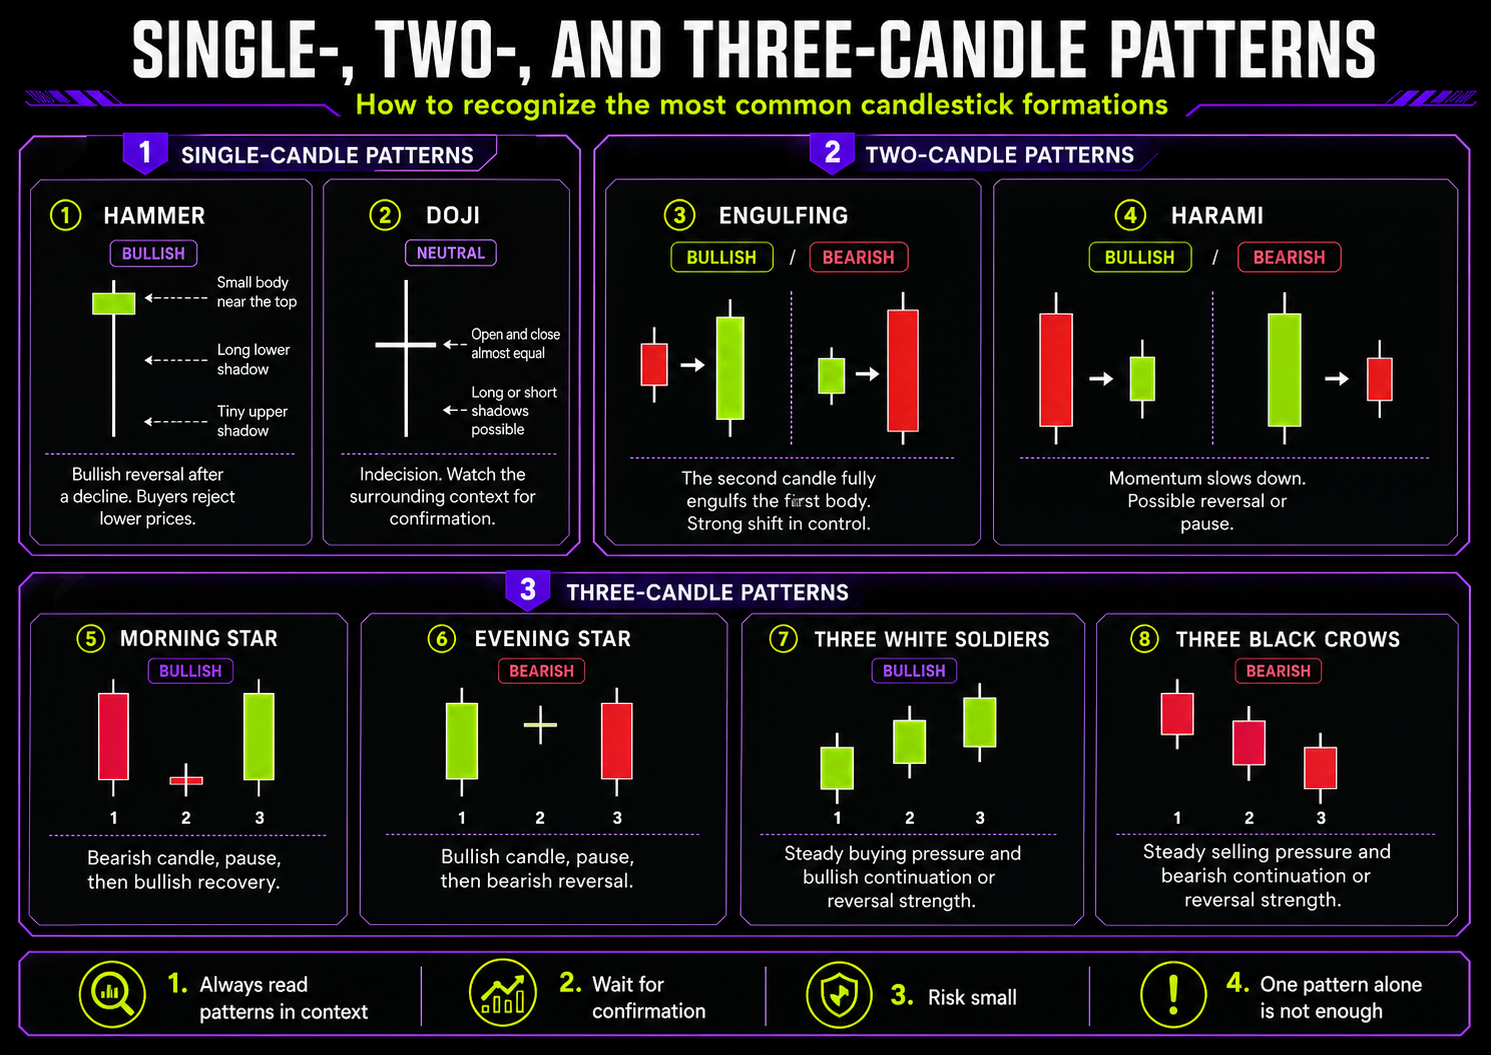
A hammer has a small body near the top of its range and a long lower shadow. It forms when selling drives the market down, but buyers recover most of the decline before the close. It is more useful after a sustained downtrend or at clear support. A close above the hammer high can confirm the signal.
An inverted hammer has a long upper shadow. Buyers moved price upward but could not keep the full gain. At the bottom of a decline, the next candle must show that demand can continue.
A shooting star has a similar shape but appears after an uptrend. Buyers pushed higher before a bearish candle or sellers forced the market back toward the open. A close below the shooting star low strengthens the reversal idea.
Hanging Man, Doji, and Spinning Top
A hanging man looks like a hammer but forms after an advance. Its lower shadow shows that significant selling occurred, even if price recovered. The candle alone is not enough for a short position.
A doji forms when the opening and closing prices are nearly equal. It represents indecision, not an automatic reversal. Near the top or bottom of a long trend, it can show fading momentum. A spinning top carries a similar message but has a slightly larger body.
Common Candlestick Patterns Technical Analysis: Two-Candle Setups
Two-candle formations compare one period with the second and show how control changed.
Bullish and Bearish Engulfing
A bullish engulfing pattern forms when a bearish candle is followed by a larger bullish candle whose body covers the first. It is most meaningful near the bottom of a decline or after sellers fail at support. The second candle shows strong buying pressure.
The bearish version appears near the top of an uptrend. A smaller bullish candle is followed by a larger bearish candle that covers its body. This indicates that sellers took control. In 24-hour crypto markets, gaps are less important than the difference in body size and the change in control.
Harami, Piercing Line, and Dark Cloud Cover
A harami uses the opposite relationship: the second body is contained inside the first. A bullish harami after a decline suggests that selling momentum has slowed; a bearish harami after an advance suggests weaker buying. Because the second candle is small, the pattern is an early warning rather than a complete entry signal.
A piercing line starts with a bearish candle and is followed by a bullish candle that closes deeply into the first body. Dark cloud cover is the bearish counterpart: a bullish candle is followed by a bearish close well inside the earlier green body. Both work better at established levels.
Common Candlestick Patterns Technical Analysis: Three-Candle Setups
Three-candle formations show a transition through pressure, hesitation, and control by the opposite side.
Morning Star and Evening Star
A morning star appears near the bottom of a downtrend. The first candle is strongly bearish, the second has a small body, and the third is a strong bullish candle that closes well into the first body. The middle candle shows a pause; the final candle confirms that buyers can move price higher.
An evening star forms after an uptrend. A large bullish candle is followed by a small candle and then a strong bearish candle. The sequence represents an advance, indecision, and a shift toward selling. If the third candle cannot break nearby support, the result may be only a pause.
Three White Soldiers and Three Black Crows
Three white soldiers are three bullish candles with progressively higher closes. They can appear after a decline or breakout and suggest sustained demand. Three black crows are three bearish candles with lower closes and indicate persistent selling.
Entering after the third large candle may mean chasing an extended move. A controlled pullback can offer a better entry and smaller risk.
Continuation Formations
Not every formation signals reversal. Some candlesticks show a pause before the existing trend resumes.
The rising three methods starts with a strong bullish candle, followed by several smaller bearish candles that stay inside or near its range. A new bullish candle then closes higher, suggesting that the pullback did not destroy the uptrend.
The falling three methods uses the opposite structure: a large bearish candle, several small bullish candles, and another bearish close. It represents a temporary correction inside a downtrend.
An inside bar is another continuation or breakout formation. Its high and low remain within the preceding candle. It shows compression, not direction; the eventual break and broader trend determine the signal.
How to Confirm a Signal
Candlestick patterns in technical analysis become more useful when several independent factors support the same idea. Start with location: the formation should appear near support, resistance, a range edge, or a meaningful trend structure. Then check whether the next candle follows through.
| Confirmation Factor | Useful Evidence | Warning Sign |
|---|---|---|
| Market structure | Higher low after a bullish signal. | Price keeps making lower lows. |
| Level | Rejection from tested support or resistance. | Formation appears in the middle of a range. |
| Volume | Activity increases with confirmation. | Break occurs on weak participation. |
| Liquidity | Spread and depth remain stable. | Thin book and sharp slippage. |
| Broader market | Bitcoin supports the direction. | Altcoin signal conflicts with a strong BTC move. |
| Risk | Clear invalidation and adequate target. | Stop is wide and the next obstacle is close. |
Indicators can add context, but related tools should not repeat the same information. RSI may show oversold momentum during a hammer, while a moving average defines the larger trend. Neither should replace the response at the level.
Entry, Stop, and Target
One entry method waits for the confirmation candle to close. This avoids acting on an unfinished formation but can produce a worse price. Another method waits for a retest of the pattern or level. A retest offers a clearer stop but may never happen.
A stop belongs beyond the point that invalidates the idea. For a bullish hammer, it may be below the low. For a bearish engulfing setup, it may sit above the pattern high. For a morning star, it can be below the formation bottom.
The target should come from nearby structure rather than an arbitrary percentage. Previous highs and lows, support, resistance, liquidity zones, and the current range are useful reference points.
Position size is calculated after the stop distance is known. A wider stop requires a smaller position, which keeps financial risk consistent.
Crypto-Specific Factors
Crypto markets trade continuously, so a “day” candle depends on the platform’s time settings. The same formation can look slightly different across exchanges because candle boundaries and data sources differ.
Low-liquidity tokens can create dramatic candles from a small number of orders. A long wick may reflect a thin order book rather than meaningful rejection. Check spread, depth, and volume before entering.
Perpetual futures add funding, leverage, liquidation, and mark-price risk. A correct visual idea can still produce losses if the position is oversized. News and token events can also invalidate historical patterns quickly.
False Signals and Common Mistakes
The main mistake is reading shapes without context. A hammer may look bullish, but if it forms below broken support and the next candle makes a new low, the setup has failed.
Another error is acting before the candle closes. A formation that looks like rejection halfway through the period can become a large bearish candle by the close.
Traders also confuse color with strength. A green candle with a long upper shadow may show weaker demand than a small red candle that holds support. Body, wick, level, and follow-through matter more than color alone.
Technical analysis candlestick patterns can be found by automated tools, but software recognizes geometry, not whether a trade is appropriate. Traders and investors still need to evaluate context, risk, and execution.
Practical Workflow
| Stage | Action | Question |
|---|---|---|
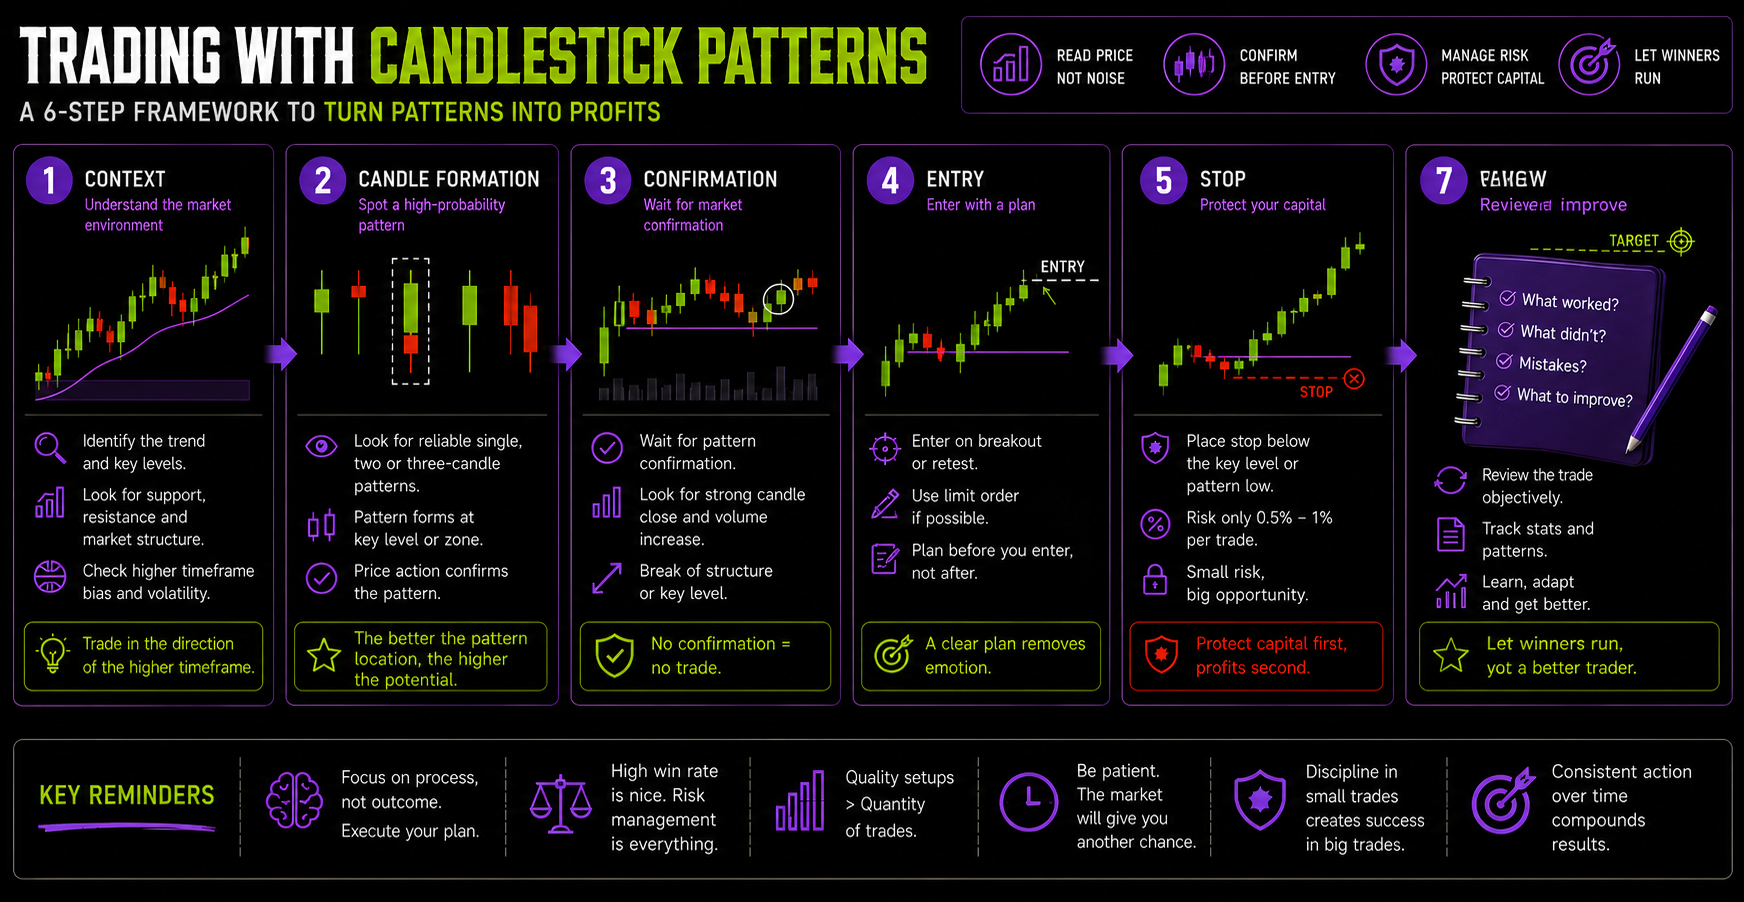
| Context | Define trend or range. | Where does the formation appear? |
| Pattern | Identify the candle sequence. | Is it complete and correctly located? |
| Confirmation | Wait for follow-through. | Did the expected side gain control? |
| Risk | Mark invalidation. | How much can the trade lose? |
| Entry | Choose close or retest. | Is liquidity sufficient? |
| Target | Use market structure. | Is the potential reward adequate? |
| Review | Save images and research data. | Was the plan followed? |
This process turns pattern recognition into repeatable work and helps create a useful historical sample.
How to Practise
Start with a short list instead of memorizing every name. Hammer, shooting star, doji, engulfing, harami, morning star, and evening star are enough to learn the logic of reversals.
Move through historical charts one candle at a time. Mark the trend, level, confirmation, and invalidation before revealing future candles. Save successful, failed, and incomplete examples.
Then test one market and time frame. Record win rate, average gain, average loss, fees, and rule compliance. The aim is not to prove that a pattern will always work; it is to understand the conditions in which it is likely to be useful for trading or investing.
Conclusion
Candlestick patterns in technical analysis translate open, high, low, and close data into a visual record of market pressure. Single candles show rejection or indecision, while multi-candle formations show how control changes across several periods.
The strongest signals appear at meaningful levels, align with the broader trend or a clear reversal structure, and receive confirmation from later action. Volume, liquidity, and market context improve understanding, but no method can completely remove uncertainty.
A candlestick formation should help define a scenario, not replace a full strategy. Identify the level, wait for confirmation, set the invalidation point, calculate position size, and accept that some signals will fail. That process is more valuable than memorizing a large collection of images.