

Crypto Fear and Greed Index: What Is It and How Does It Work?
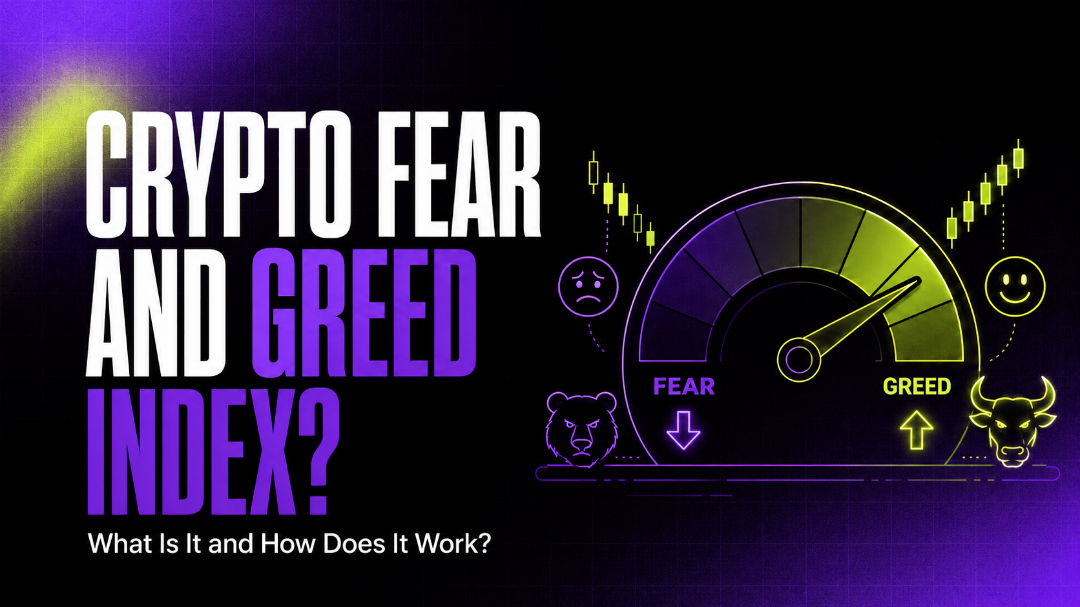
A crypto fear and greed index combines several market indicators into one sentiment score, usually presented on a scale from extreme fear to extreme greed. The calculation may include volatility, price momentum, trading volume, market dominance, social activity, search interest, and derivatives data. Low readings indicate fear, while high readings indicate greed. Traders use the index as a context filter, but every decision still requires confirmation from price structure, volume, liquidity, and risk management.
Table of Contents
What Is a Crypto Fear and Greed Index?
A crypto fear and greed index is a sentiment indicator designed to summarize the current mood of market participants. It collects several types of data, normalizes them, and produces a single value.
Lower readings usually mean that traders are reducing exposure, avoiding new purchases, or closing leveraged positions. Higher readings suggest that participants are willing to accept more risk, follow strong momentum, and buy assets that have already increased in price.
The indicator does not measure human emotions directly. It interprets observable market behavior. For this reason, different providers may calculate the index differently. One version may focus mainly on Bitcoin, while another may include altcoins, social activity, funding rates, or market-wide trading data.
Why Sentiment Is Important in Crypto
Emotions affect all financial markets, but they are especially visible in cryptocurrency trading. The market operates continuously, leverage is widely available, and information spreads through social networks within seconds.
During a rally, rising prices attract attention. More users enter the market, trading volume increases, and optimistic forecasts become more common. Price strengthens sentiment, while positive sentiment brings additional demand.
The reverse process occurs during a decline. Falling prices create uncertainty, leveraged positions are liquidated, and negative news receives more attention. Traders who entered late may sell near a local bottom simply to reduce emotional pressure.
A sentiment index helps identify these conditions. It cannot prove that the crowd is wrong, but it can show when expectations have moved far from a neutral state.
How Is a Fear and Greed Index Calculated?
There is no universal formula. Most indexes combine several categories that reflect market activity and investor behavior.
| Component | What It Measures | Possible Interpretation |
|---|---|---|
| Volatility | Size and speed of price fluctuations. | Sudden volatility often accompanies fear. |
| Momentum | Strength of recent price movement. | Rapid growth may indicate increasing greed. |
| Trading volume | Activity of buyers and sellers. | High volume confirms strong participation. |
| Market dominance | Distribution of capital between assets. | Movement toward major coins may signal caution. |
| Social activity | Frequency and intensity of discussions. | Rapid attention growth may indicate speculation. |
| Search interest | Changes in public curiosity. | Panic-related searches may increase during declines. |
| Derivatives data | Funding, open interest, and liquidations. | Crowded positions can reveal excessive optimism or stress. |
Volatility is normally compared with its recent historical range. A sudden increase during a sell-off may push the index toward fear. Strong upward momentum combined with growing volume may move it toward greed.
Some models include Bitcoin dominance. When capital moves from smaller tokens into Bitcoin, the change may indicate that participants are reducing risk. However, dominance can increase for several reasons and should not be used alone.
Social and search data attempt to measure public attention. These components can be useful, but they may also react to temporary hype, coordinated campaigns, or a single major event.
Understanding the Index Zones
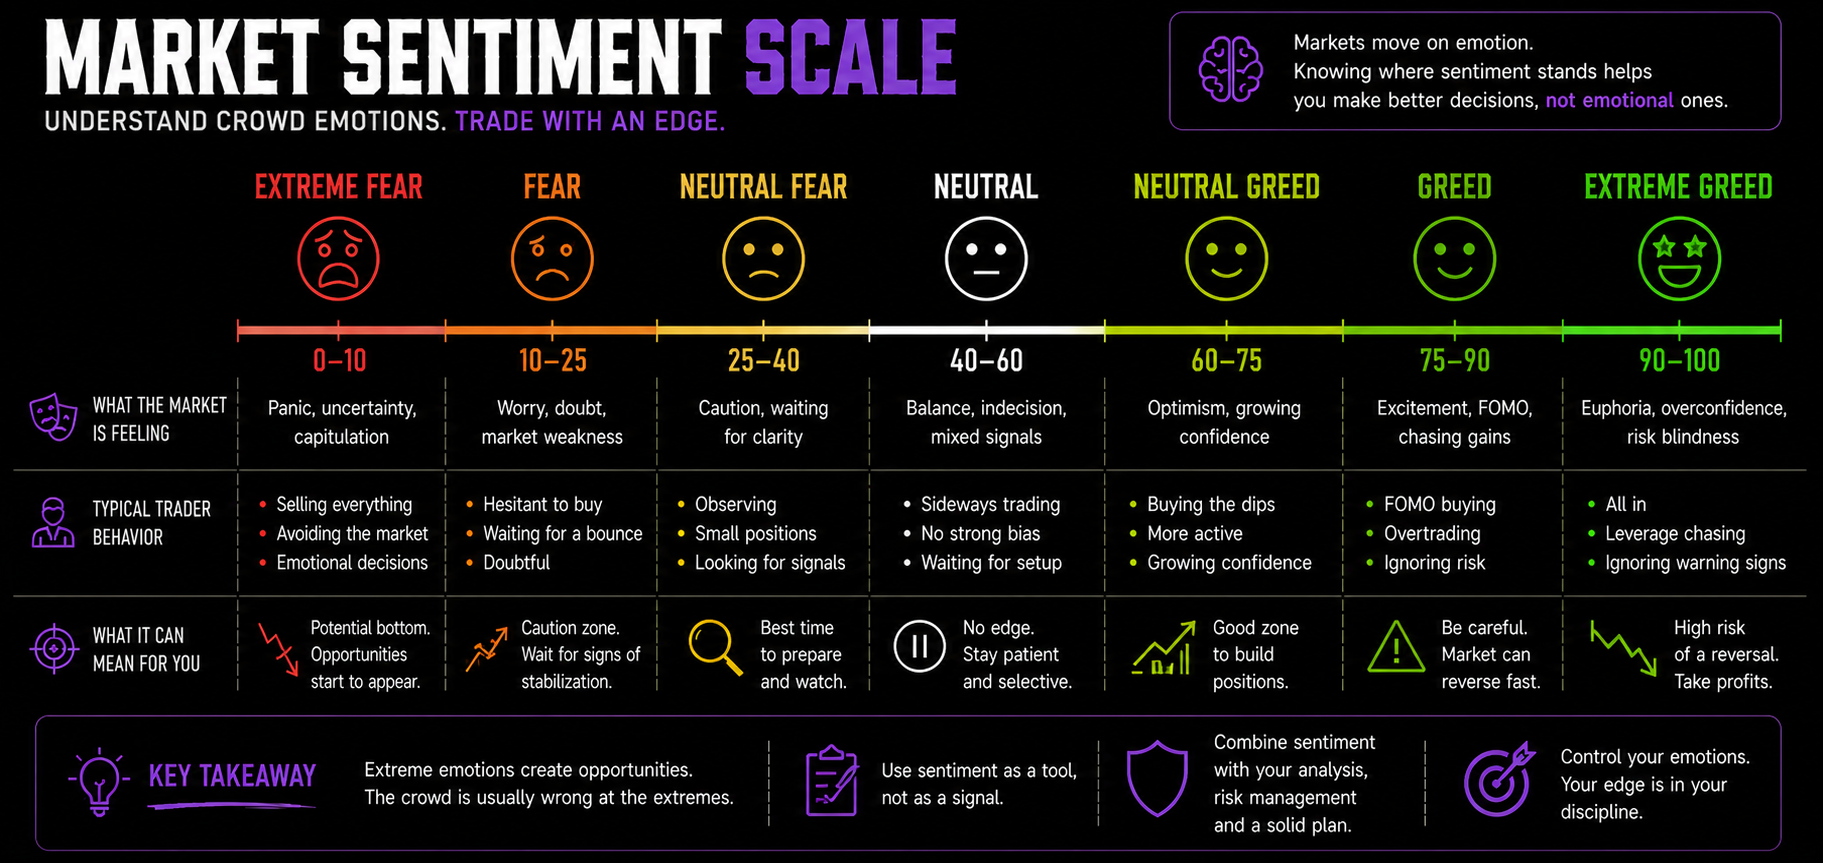
The exact boundaries depend on the provider, but the scale is commonly divided into five general zones.
| Zone | Market Mood | Typical Behavior |
|---|---|---|
| Extreme fear | Panic and strong risk aversion. | Forced selling and reduced exposure. |
| Fear | Cautious positioning. | Traders wait for confirmation. |
| Neutral | Balanced expectations. | Neither side has a clear emotional advantage. |
| Greed | Strong risk appetite. | Participants increase exposure. |
| Extreme greed | Overconfidence. | Late entries and excessive leverage become more common. |
Extreme fear does not mean that the market has already reached a bottom. Price can continue falling while sentiment remains depressed. Extreme greed does not guarantee an immediate correction either. In a strong bull trend, optimistic sentiment may remain elevated for a long period.
The useful question is not simply whether the reading is high or low. Traders should ask how price behaves while sentiment is in that zone.
How Traders Use Fear and Greed Indexes
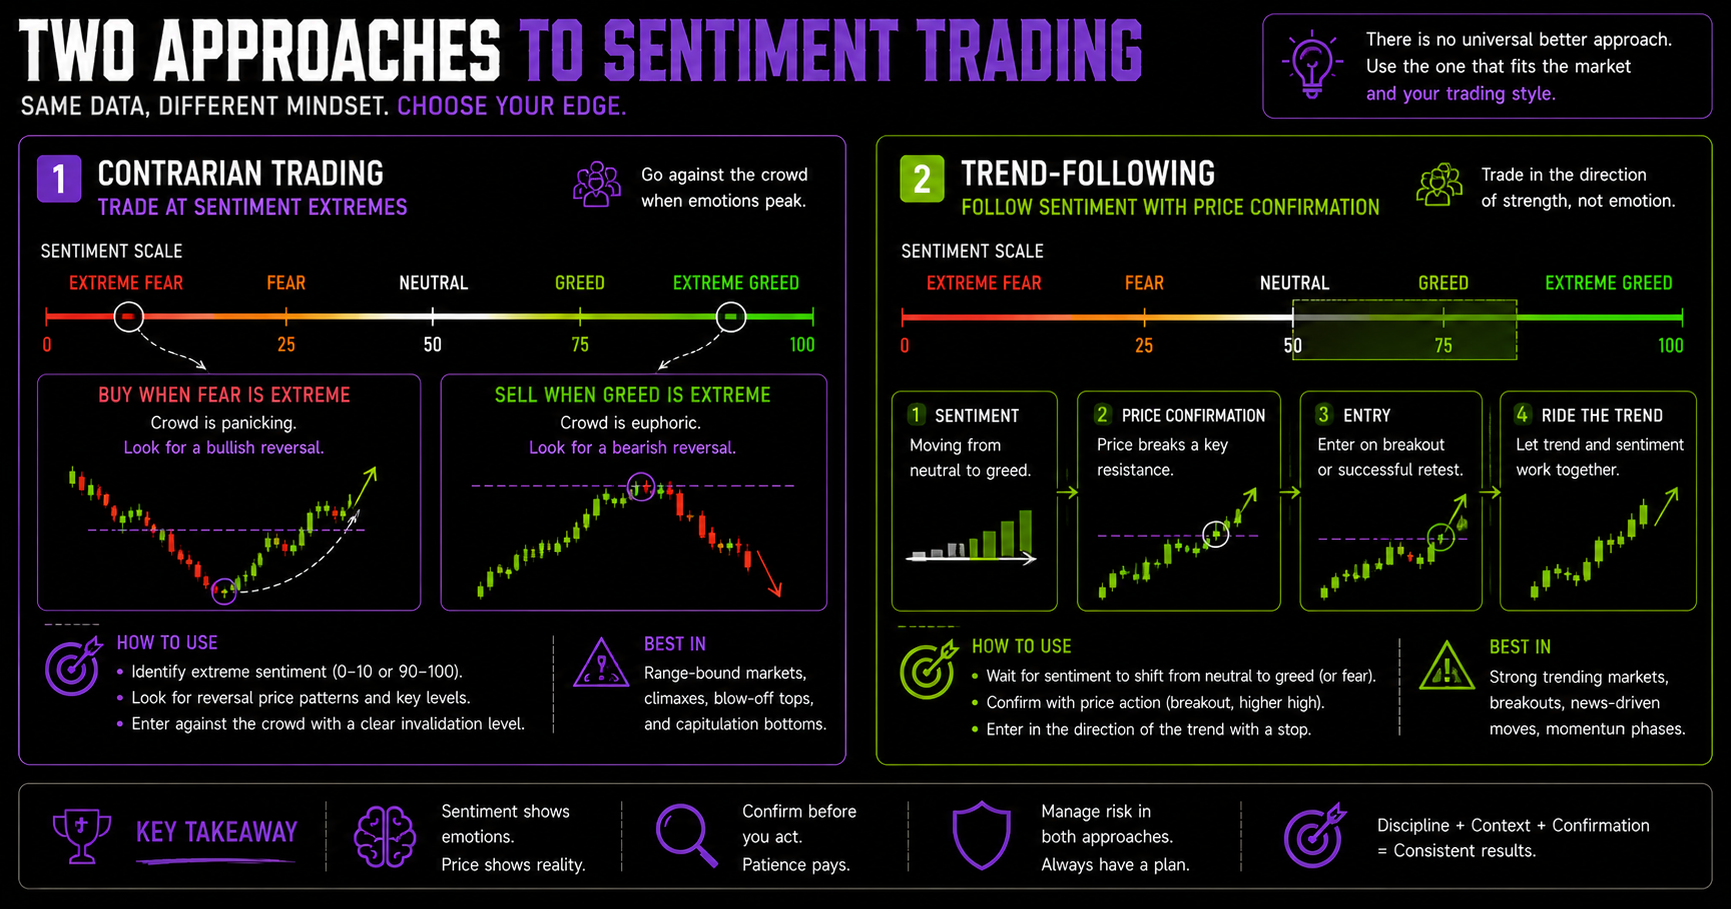
The index works best as a context filter. It can help traders decide whether current conditions favor caution, momentum trading, or a search for contrarian opportunities.
A contrarian trader may look for buying opportunities during extreme fear. However, a low score is not enough to open a position. The trader first waits for evidence that selling pressure is weakening: support holds, declines occur on lower volume, liquidations slow, or price forms a higher low.
During extreme greed, the same trader may watch for failed breakouts, weaker momentum, high funding rates, or an inability to remain above resistance. The index identifies an overheated environment, while the chart provides the actual entry conditions.
A trend-following trader can interpret greed differently. High sentiment combined with rising volume and a clear uptrend may confirm strong participation. Instead of opening a short position, the trader may follow the trend while reducing leverage and avoiding late entries.
Sentiment in Different Market Phases
The meaning of fear and greed changes throughout the market cycle.
At the beginning of a recovery, the index may remain in fear even after price stops making new lows. This can indicate that market structure is improving faster than public expectations.
During the middle of a bull market, greed may reflect healthy demand rather than immediate exhaustion. Price can continue rising while new capital enters the market.
Near a speculative peak, extreme greed may be accompanied by rapid growth in low-quality assets, high leverage, unrealistic price targets, and reduced attention to risk.
During a bear market, short-term rallies can temporarily push the index toward neutral or greed. A more positive reading does not automatically change the long-term downward structure.
For this reason, the index should always be compared with trend, support and resistance, volume, and derivatives positioning.
Can the Index Identify Tops and Bottoms?
Fear and greed indexes can highlight conditions often seen near market turning points, but they cannot identify the exact price or timing.
A low reading may appear before the final decline, during it, or after the market has already formed a bottom. A high reading may develop early in a rally and remain elevated until much later.
The index may become more informative when it diverges from price. For example, Bitcoin may retest a previous low while the sentiment score shows less fear than during the first test. This can indicate that panic is weakening.
The opposite situation may occur when price reaches a new high but sentiment fails to become more optimistic. Such a divergence may suggest that enthusiasm is no longer increasing with the trend.
Divergence is still not a complete signal. Price must confirm the change before a trade is opened.
A Practical Workflow
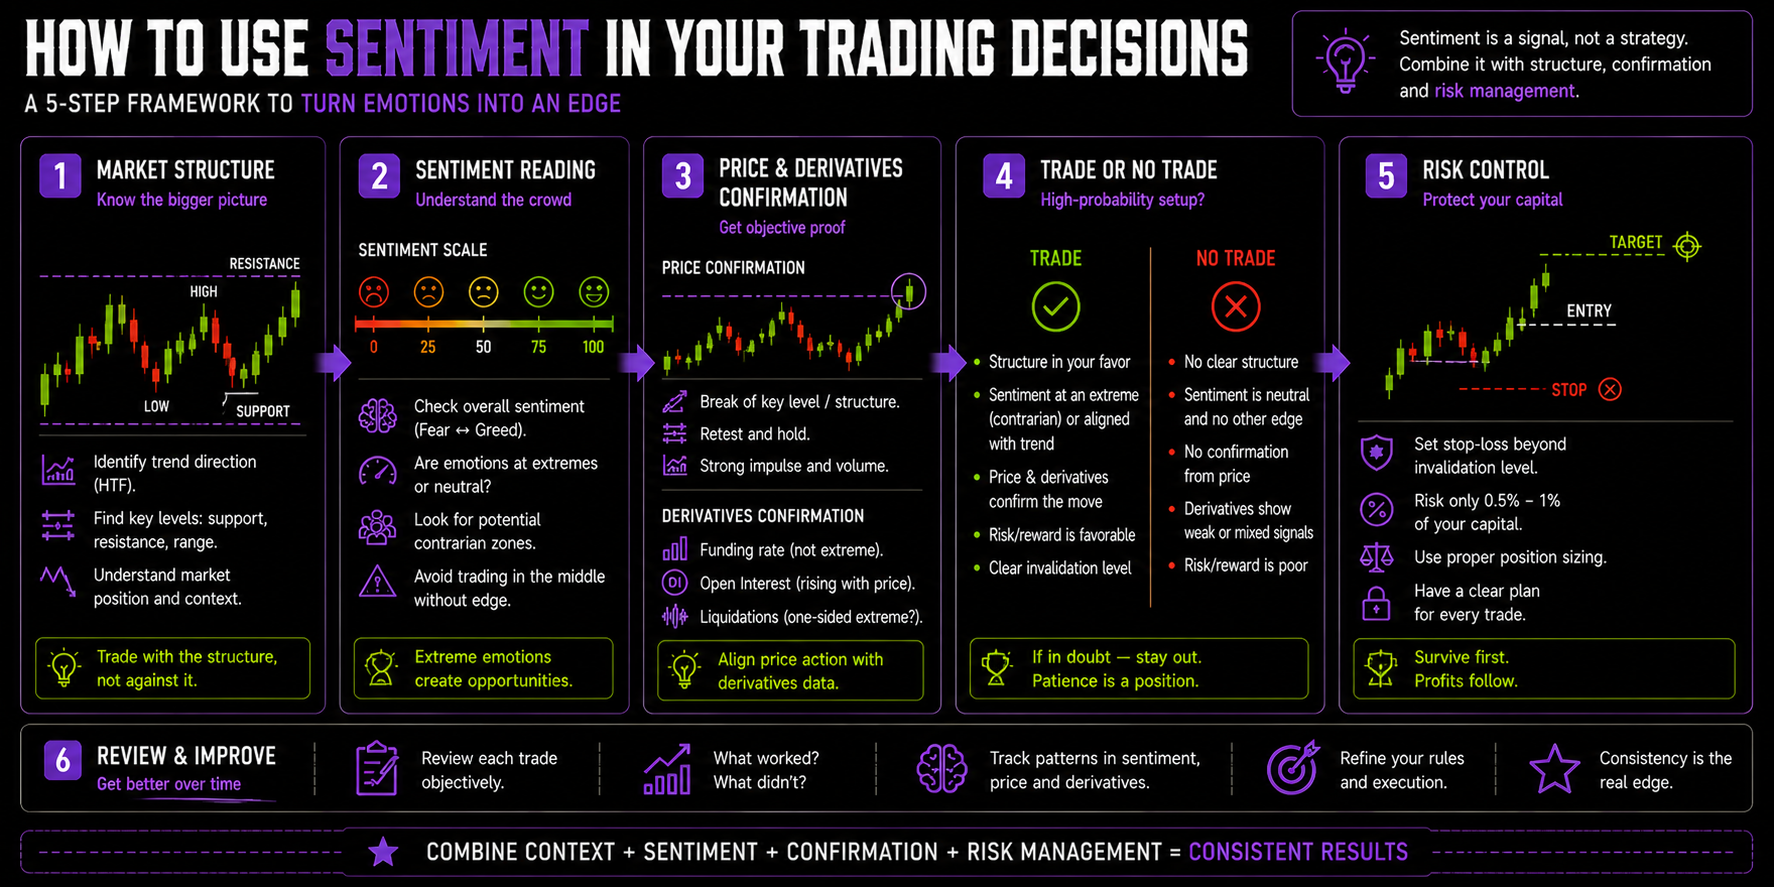
A structured process prevents the index from becoming another source of emotional decisions.
First, determine the larger market structure. Is Bitcoin trending, ranging, or testing an important level? Then check the sentiment zone and the speed of its change. A gradual move into greed differs from a sudden increase after one volatile session.
Next, examine price action, volume, open interest, funding, and liquidity. Look for confirmation or contradiction. If sentiment is extremely fearful but price continues to accept lower levels, buying only because the index is low is risky.
Finally, define the entry trigger, invalidation point, position size, and target. The sentiment reading should never determine the amount of capital placed at risk.
| Stage | Main Question |
|---|---|
| Market structure | What is the dominant trend or range? |
| Sentiment | Is the market fearful, neutral, or greedy? |
| Confirmation | Does price support the sentiment-based idea? |
| Risk | Where does the scenario become invalid? |
| Execution | Are liquidity and spreads acceptable? |
| Review | Did the index provide useful context? |
Main Limitations
The first limitation is methodology. Each provider selects different components and assigns its own weights. A single score can hide conflicting information: volatility may indicate fear while momentum suggests greed.
The second limitation is delay. Most components are calculated from recent market data. The index describes conditions that have already developed rather than predicting what happens next.
The third limitation is asset coverage. An index focused on Bitcoin should not automatically be applied to every altcoin. A smaller token may respond to its own news, liquidity, token unlocks, or community activity.
The fourth limitation is market regime. The same score can have a different meaning during a bull market, bear market, or low-volatility range.
Finally, the index can reinforce confirmation bias. A trader who wants to buy may interpret fear as an opportunity, while another may see the same reading as proof that the market remains weak.
Common Mistakes
The most common mistake is buying every extreme-fear reading and selling every extreme-greed reading. Sentiment extremes describe the environment, not the timing of a reversal.
Another mistake is ignoring the speed of change. A score that remains low for a week is different from one that collapses within several hours after mass liquidations.
Traders may also compare readings from different providers without checking how each index is calculated. Similar-looking numbers may be based on different inputs.
The final mistake is replacing risk management with sentiment analysis. Even a logical contrarian setup can fail. Stop-losses, position limits, and daily drawdown controls remain necessary.
Conclusion
Crypto fear and greed indexes combine several market signals into a simple sentiment score. They help traders understand whether caution, panic, optimism, or speculation currently dominates the market.
Their main value is context. Extreme fear may draw attention to possible seller exhaustion, while extreme greed may warn that positions are overcrowded. Neither reading is a complete buy or sell signal.
Use the index together with market structure, price action, volume, liquidity, funding, and open interest. Wait for confirmation and calculate risk before entering a position.
The index does not tell traders what to do. It helps them ask a more useful question: is the current decision based on a valid market setup, or is it being driven by the same fear and greed influencing the rest of the market?