
Contents
What Is Scalping
In this article, we're going to break scalping down as a practical trading process. We'll look at what scalping really is at the session level, how short-term price impulses form through liquidity and order-book imbalance, and how those impulses can be traded with defined risk. From there, we'll move into the core components of a scalping plan and walk through the main strategy archetypes traders use to execute these ideas consistently.
This matters because scalping leaves very little room for improvisation. Decisions are made under pressure, moves resolve quickly, and small execution errors compound fast. Without a clear framework, it's easy to confuse noise for opportunity, overtrade dead conditions, or let risk drift out of control. With structure in place, scalping becomes far more mechanical: you know what you're waiting for, what invalidates the idea, and when the trade is finished.


At its core, scalping is a short-term trading style built around fast, controlled intraday price impulses. What we're doing is trading small, repeatable moves that form when short-term balance breaks and price is forced to quickly reprice. These moves usually play out on lower timeframes — 15-minute, 5-minute, 1-minute, and sometimes even second-based charts — and they're held for minutes or seconds, not hours.
A scalper almost never seeks to catch the 'big move' of the day. Instead, you're collecting small, defined pieces of movement, over and over within the session, with tightly controlled risk. The edge in scalping comes from clean execution, repetition, and keeping losses tightly in check when an idea doesn't play out.
Even though execution happens on the lower timeframes, the focus isn't limited to short-term. We always analyse top-down — typically starting from the 1-hour or daily chart — where we mark the areas that already matter to the market. These are prior highs and lows, consolidation zones, and places where price has clearly accelerated or stalled before. Those levels give us structure, and the lower timeframes are just where you time your entries and manage risk.
For scalping to work at all, the market has to meet a few basic conditions. First, liquidity. You need a trading instrument with an order book thick enough to let us enter and exit quickly without giving up too much to slippage. Second, intraday volatility. For scalping strategies to be bread-and-butter, price has to continuously gyrate up and down during the session. If liquidity is thin or the market is completely dead, even the best execution won't save the trade.
That's why preparation comes first. Before the session starts, you need to decide:
- What you're trading and why,
- How much you're willing to risk per attempt
- And where your daily loss limit sits.
Once that foundation is in place, scalping stops feeling random — even on 1s charts — and becomes a routine that feels almost mechanical.
In the next section, we'll break down the core elements of a scalper's trading plan and show how they fit together in real-time decision-making.
Core Elements of a Scalping Strategy
A trading strategy isn't some vague idea like "uhm, I think this goes up so I buy." It's a concrete multilayered plan that answers a few very specific questions before you even consider a trade. You need to know what has to happen for you to get involved, where you expect to get paid if things go your way, and where you're willing to admit the idea didn't work.
That kind of structure matters in any trading style, but in scalping it's actually non-negotiable. Once you're in a short-term trade, everything happens at light speed. Price moves, the tape speeds up, the book shifts before you can ever realize what's going on. There's no time to stop and "think it through," and sure enough there's no time to "wait out a drawdown." If the plan isn't already there, you end up reacting — and reacting under pressure is how bad trades happen.

At a practical level, almost every scalping strategy is built from the same set of core building blocks, and those are:
- Expected price movement
This is the move you're trying to work — a push to a level, a bounce, a breakout, a liquidity grab. Just flesh out some working hypothesis: if conditions line up, price is likely to move from here to there. This gives the trade its context. - Entry point
That's the specific time & place on the chart where you're willing to get involved. Not "somewhere around the level," but a clear trigger — something you see on the chart or in the order flow that tells you it's time to act. - Exit point
This is where you plan to close the trade positive should the scenario play out. This defines success ahead of time and keeps you from hanging on just because the trade feels good. - Stop-loss level
The point where you admit that the idea didn't work and step aside, having paid a fixed fee. The keyword is fixed — your stop loss absolutely has to be defined in advance and be tolerable enough for you to just move over to the next trade. - Take-profit levels
The point where the trade is considered done. You've taken what the market offered, and there's no reason to keep pressing. A good habit is to take partial profits — for instance, at 25%, 50%, 75% and 100% of the expected PnL. This way you're safeguarding yourself against a nasty reversal into red PnL levels, which on lower timeframes can happen oh-so-often.
If even one of these pieces is missing — or left to be figured out on the fly — the whole system starts to leak. You entries become based on guesswork, exits turn emotional, and risk quietly creeps higher than your tolerance levels. That's usually when tilt starts sneaking in, and results begin to depend more on mood than on process.
The fix is simple in principle, even if it takes discipline in practice: every part of the trade needs to be defined before you click the button. Not down to the last tick, but clearly enough that once you're in, there's nothing left to argue with.

Next, we'll go through these elements one by one and look at how they're actually specified in real scalping setups — the kind you execute live, without hesitation, while the market is moving.
From Structure to Action: How Scalping Strategies Are Actually Applied
At the micro level, almost every scalping opportunity comes from the same source: temporary intraday order-flow imbalance. During a given trading session, one side of the marketplace almost always becomes more aggressive, resting liquidity gets absorbed, old stops are triggered, participants seek to attack or defend a level. Price responds to all that by jumping between areas where liquidity is up for grabs. That's manifested as short — yet strong — one-sided impulse price moves. Once balance is restored, the impulse ends.
Most scalping strategies are built around how price behaves near key levels: local and recent Highs & Lows, Support & Resistance levels — in other words, wherever liquidity is stacked. That's why scalping lives is so bound to market structure. These impulses tend to form around the same intraday reference points again and again:
- prior highs and lows where stops cluster
- well-defined support and resistance inside the session
- range boundaries where balance has held before
- visible liquidity pockets in the order book
Your goal isn't to ride a trend, but rather to extract a controlled piece of movement that happens when price transitions between these key zones. That's also why your risk has to be tight and your executions — precise. These trades don't give you time to "be wrong slowly" or "wait out a drawdown." Either the imbalance resolves in your direction, or it doesn't. Below are the core strategy archetypes scalpers use to work these impulses in real time.
Now let's move over to how scalpers approach building their trade models based on the behavior of price around key levels.
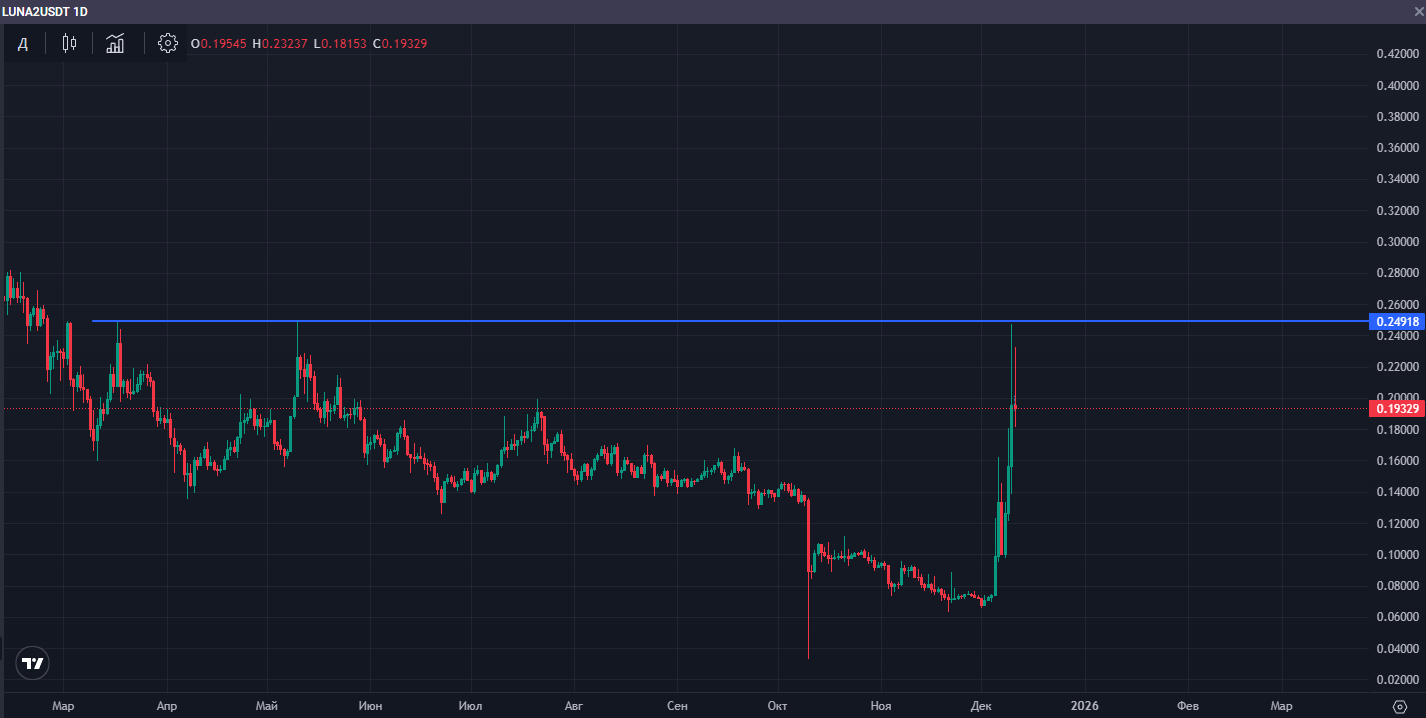
1. Level Breakout
If you've been trading for a while, you'll be familiar with the concept of a breakout — a definitive one-directional price move that most often violates a key level — like support and resistance, old highs and lows. In scalping, a breakout isn't simply price touching or crossing a line on the chart. It's a regime shift — price moving out of a previously accepted range and beginning to trade at a new set of prices. The key isn't the moment of the break itself, but whether the market shows acceptance above or below the level afterward.
Most high-quality breakouts develop in the direction of the higher-timeframe bias, typically defined on the 1-hour or 4-hour charts. These higher-TF levels are areas where price has previously stalled, reversed, or generated strong reactions. Once such a level is identified, you drop down to the lower timeframes — 15-minute, 5-minute, or 1-minute — and closely monitor how price behaves as it approaches.
At that stage, the focus shifts to a few practical questions:
- Does price stall or reject the level on first contact?
- Do local highs and lows begin compressing into the level?
- Are resting orders in the book being defended, or are they getting absorbed?
- Does the tape show increasing aggressive buying or selling as price leans into the level?
A valid breakout usually resolves in one of two ways.
The first is a break-and-retest. Price pushes through the level, pulls back to test it from the other side, finds acceptance, and then continues in the breakout direction. The quality of the retest — shallow pullbacks and quick re-engagement — often tells you whether acceptance is real.
The second is a momentum breakout. Price exits the range with speed, volume expands, and there's little to no retracement. In these cases, acceptance is seen through strong follow-through rather than a clean retest.

Stops in breakout trades are typically placed just beyond the level being broken — below it for longs, above it for shorts — or behind the nearest local high or low that would clearly invalidate acceptance. Profit targets are usually set at the next liquidity area: a prior high or low, the boundary of an older range, or a large resting order visible in the order book.
1.1 False Breakout (Stop Hunt)
A false breakout — often called a stop hunt or failed breakout — is the inverse of a clean breakout. It's one of the most important intraday situations we trade as scalpers because it resolves quickly and offers clearly defined risk.
In this setup, price does break a level, and on the surface it behaves exactly like a legitimate breakout. Price accelerates through a prior high or low, stop orders are triggered, and breakout traders begin entering. Volume expands, the tape becomes active, and liquidity sitting just beyond the level is steadily consumed. From the outside, the move looks convincing and continuation appears likely.
The setup is defined not by the break itself, but by what happens immediately after. Despite the initial aggression, the market fails to establish acceptance beyond the level. Price struggles to hold the new area while momentum fades. Instead of building higher or lower, price starts rotating back toward the range it just left. And that inability to sustain trade at the new prices is the core signal for scalping.
As the initial impulse exhausts itself, initiative transfers to the opposite side, and what looked like directional strength reveals itself as mere liquidity-taking. Once stops are cleared and late participants are committed, there's often no remaining reason for price to stay outside the range — which is why these reversals tend to be fast and decisive.
Because of that, entries in false breakout setups come after the failure is confirmed, not during the initial break. Once price returns back inside the range — below the level for shorts or above it for longs — and order flow confirms that pressure has flipped, the trade becomes structurally sound. The stop usually sits beyond the extreme of the false breakout, where the failure would be invalidated, and targets are typically set toward the opposite side of the range or the nearest meaningful intraday level.
2. Level Rejection / Bounce (Intraday Reversal)
A level rejection, or bounce, occurs when a level holds. Price trades into it, applies pressure, and then fails to move through. Instead of acceptance and continuation, the pressure is absorbed and price rotates back in the opposite direction. Structurally, this is the opposite of a breakout — the market tests for continuation and gets rejected.
These setups almost never resolve in a single clean touch. Price usually works its way into the level and initially behaves as if a break is possible. Over time, that behavior changes. Momentum fades, progress slows, attempts to push through the level become less effective. Price probes into the zone, pulls back, tests again, and each attempt produces less follow-through. Eventually, the market stops advancing and begins rotating away, setting up an intraday reversal.
Preparation for these trades usually happens in advance. On higher timeframes, we mark areas where the market has already shown repeated interaction — prior highs and lows, consolidation zones, key volume clusters. These are areas where size has traded before, positions were built or unwound, and where it's reasonable to expect some form of defense again.
As price returns to one of these zones, our job is to observe how it behaves on approach. We're looking for signs that pressure is being absorbed rather than accepted:
- momentum slowing instead of accelerating
- candles leaving wicks into the level rather than closing cleanly through it
- repeated tests at similar prices with no net progress
Order flow often confirms what the chart is already hinting at. In the order book, bids or offers appear and remain in place as price leans on them. At the same time, aggressive market orders continue to print into the level, but price fails to move. That imbalance — effort but no result — is a strong indication that the level is holding.
Entries come only once the failure becomes clear. A local high or low forms, price reacts away from the level, and initiative begins to shift to the opposite side. As aggression flips, the book starts to rebalance, and continuation away from the level becomes the higher-probability outcome.
Stops in bounce setups are typically placed just beyond the local extreme or behind the part of the zone where rejection is clearly invalidated. If price trades there, the idea no longer holds. Targets depend on the structure you're trading — sometimes a move back to the middle of the range, other times a rotation toward the opposite boundary.
Bounce setups reward patience more than speed. There's no advantage in being early. The edge comes from waiting for proof that the level held and then executing cleanly once pressure has clearly failed.
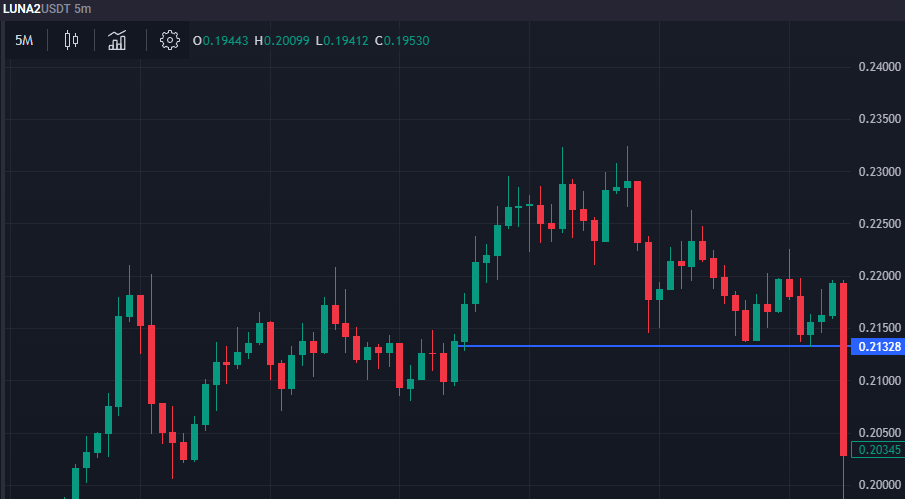
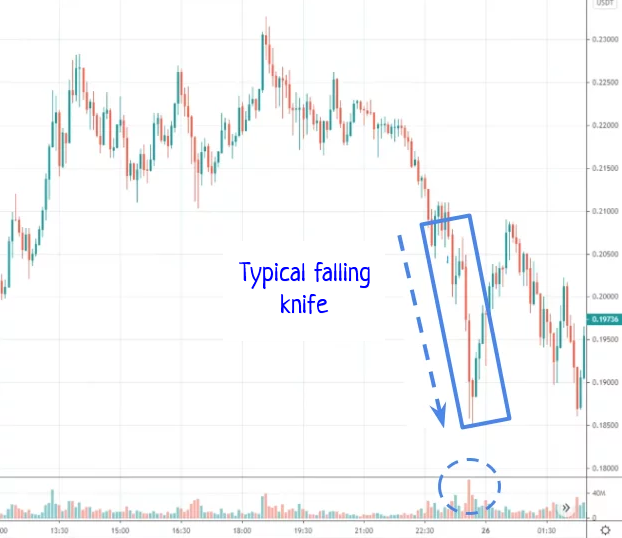
3. Knife Catching / Countertrend Trading
A falling knife is a rapid, one-directional price move driven by forced execution rather than normal two-sided trade. Price moves aggressively in a single direction, skips all structure instead of interacting with it, and offers little to no opportunity for pullbacks or stabilization until the move exhausts. There are no pauses, no meaningful pullbacks, no real respect for levels that would usually matter in a healthy trend move. Price simply keeps moving in one direction, cutting through structure as if it isn't there, until it finally reaches a point where it can no longer continue.
That's what separates a knife from most other intraday moves. In a typical breakout or trend, price still respects some rhythm — it pushes, pauses, pulls back, then continues. In a knife, that rhythm disappears. One side dominates completely. Market orders keep hitting, liquidity keeps getting cleared, and price is forced to reprice quickly just to find someone willing to stand in the way.
If you watch crypto markets long enough, you see these moves constantly. A dump starts and support after support simply evaporates. Or a pump takes off and rips straight through nearby highs without hesitation. On higher timeframes, the entire sequence often compresses into a single oversized wick, but on the lower timeframes it feels aggressive and relentless while it's happening.
Knife catching is about what happens after that phase — not while price is still slicing through levels, but at the point where continuation stops being effortless and behavior visible begins to change. Most of the work here is actually waiting and staying out of the way. You let the move extend and you avoid trying to call the exact top or bottom, because that's usually how you'll get run over.
Eventually, you start noticing small shifts: candles stop closing cleanly in the direction of the move and begin leaving large wicks. The tape, which was relentlessly one-sided, starts to thin out. Orders become smaller and less urgent. In the order book, bids or offers appear and actually stay there, absorbing trades instead of flashing and disappearing. Quite often, there's also a noticeable burst of volume right near the extreme, suggesting that real size has stepped in.
The objective here is to capture the first reaction once the pressure breaks. A clean bounce one clean scale of profit is enough. This setup is dangerous because you're trading directly into momentum. It's not a setup to force or to build an entire system around. If the move hasn't finished, it won't hesitate — it will continue straight through your position, often with slippage in fast conditions. That's why knife catching only makes sense with hard constraints: limited attempts, a clearly defined risk budget for the scenario, and execution tools that can keep up.
Your position size should be smaller than usual, and the stop should be tight and obvious — just beyond the most recent extreme. If price pushes further, the idea is invalidated immediately.
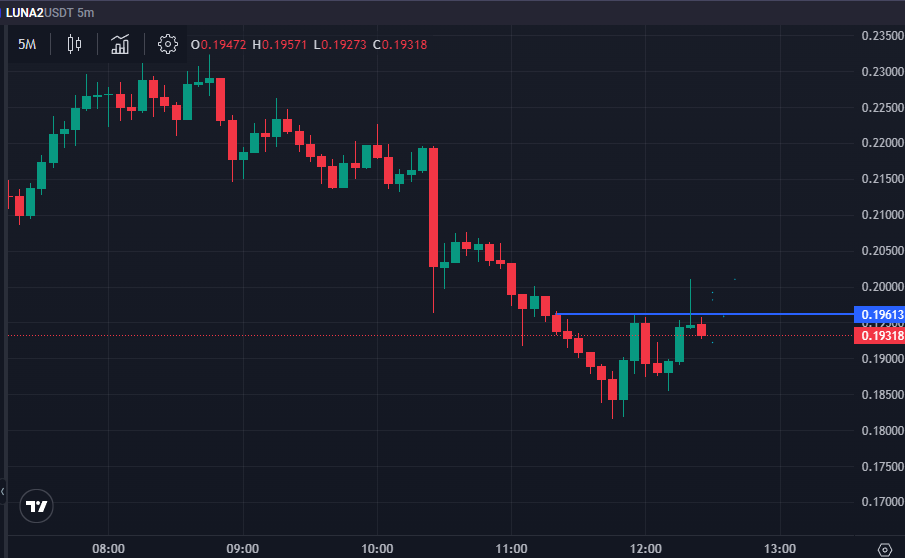
4. Range Scalping (Trading the Boundaries)
A range is a market state where price is accepted within a defined corridor and repeatedly rotates between an upper and lower boundary instead of trending. Rather than expanding into new territory, price spends time moving back and forth, testing the same areas of support and resistance and finding willing buyers and sellers on both sides.
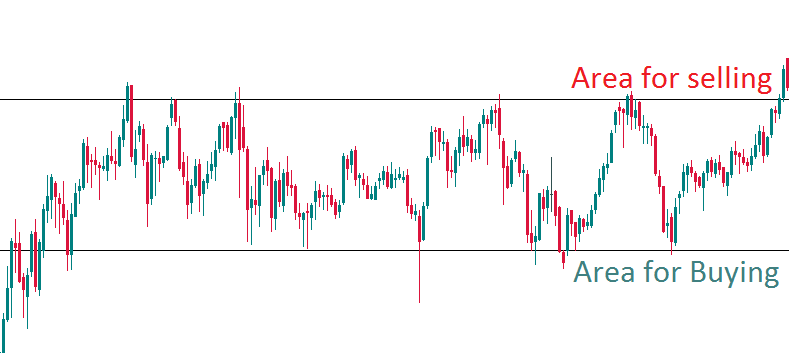
Range scalping is simply trading those rotations. You're working inside the space the market has already agreed on, entering near the edges of the range and exiting as price moves away from them.
The first step is recognizing that a range actually exists. On higher and working timeframes, that means seeing multiple reactions from both above and below, with no sustained directional follow-through. Price moves, stalls, turns, and comes back — again and again. Once those upper and lower boundaries are clear, the range becomes your operating environment.
From there, the focus shifts to how price behaves as it approaches each edge. Near the lower boundary, you want to see demand showing up: price hesitating on the way down, repeated bounces, bids appearing in the order book and holding, and aggressive selling in the tape starting to lose momentum. Near the upper boundary, the logic flips. Price slows on the way up, offers stack on the ask, and buying pressure begins to fade.
Stops in range setups are typically straightforward — just beyond the range boundary (on either side), with a small buffer for wicks and noise. If price breaks through and starts accepting beyond that point, the range idea is no longer valid. Targets are set where price can realistically rotate to — the midpoint, a prior reaction area, or the opposite boundary, depending on the current structure within the range.
Range scalping works best in balanced, 'conservative' markets with solid liquidity and controlled volatility. If price starts whipping around erratically or repeatedly threatens to break out, the edge quickly disappears. But when the market is calm, well-defined, and willing to rotate, range trading can offer some of the cleanest and most repeatable scalps in an entire session.
How to Reduce Risk and Improve Strategy Performance
Let's talk about what really moves the needle in scalping: controlling risk and improving execution quality. We'll start with risk, because in scalping it comes first — always.
The core requirement here is a hard risk profile. Before the session starts, you decide how much you're willing to lose on a single trade and how much you're willing to lose on the day as a whole — in dollars or as a percentage of your account. Once the session begins, that profile does not change. You can adjust entries, tactics, even the number of trades — but risk stays fixed. A common reference point is no more than 1% of the account per trade, often less for active scalpers.
Position size is always calculated from the stop — not the other way around. First you define where the stop-loss sits and how far it is from entry. Only then do you calculate contract size so that, if the stop is hit, the loss matches your predefined risk. Alongside that, you set a daily loss limit to prevent tilt from taking over. If, for example, you plan to take around ten trades in a session with a $1 risk per trade, your daily limit might be $10. Once that number is hit, the session is over; terminal closed. No exceptions.
Next comes trade management — what you do after the position is already open. A common and effective approach is partial profit-taking. You close part of the position at the first reasonable level — a nearby liquidity pool, the middle of the range, a local imbalance — and manage the remainder more flexibly. If momentum holds, you let it run toward the main target. If the impulse fades, you exit at market. You can start with even partials like 25%, 50%, 75% of the target, and then tailor those proportions to match your risk appetite in a given trade.
Trailing stops can also help, but only when they're used with structure in mind. Instead of moving the stop arbitrarily, you tie it to market logic: a newly formed local high or low, a level that price has already accepted beyond, a liquidity area that has been cleared. Done correctly, this allows profitable trades to extend further without increasing the original risk, while gradually locking in gains.
And finally: technical setup matters more than most traders want to admit. Your trading terminal needs to be fast, predictable, and comfortable. You should be able to place, move, and cancel any type of order instantly, in any size, without friction. Hesitation caused by interface issues costs real money in scalping.
Hotkeys, macros, and automated functions for order placement translate directly to your scalping edge. One shortcut to enter with predefined risk, another to close the position instantly, another to cancel all resting orders on the instrument. Price alerts, volume alerts, and PnL notifications help you stay focused without staring at the screen nonstop. Missing a key level, a sudden volume spike, or your daily loss limit because an alert wasn't set is entirely avoidable.
All of these measures reduce the number of things that can go wrong during a trade. This way, you'll have fewer delays, fewer manual errors, fewer emotional decisions under pressure. And over time, that reduction in friction translates directly into more consistent results — not because the strategies changed, but because execution stopped leaking value.
In Closing: What Really Matters When Building Scalping Strategies
Scalping a lot like riding in a skate park or a snow park. You're not moving along a smooth, predictable road — you're dealing with a complex terrain: ramps, rails, gaps, drops, and hard ground underneath. In theory, you could just build speed and jump wherever your eyes land, hoping the board somehow finds a place. But anyone who's ever overshot a ramp knows exactly how that ends.
So before riding, you study the park. You mark the boundaries, the takeoff points, the landings, the angles, the possible lines. You build a mental map: accelerate here, launch here, land here, then flow into the next element. Scalping works the same way. You build a "map of the park," where levels on the chart, local highs and lows, and clusters of orders act as your reference points.
In scalping, higher-level factors like trends, sentiment, or macro context exist mostly as background. They set the tone, but they rarely trigger the trade. The working part of the strategy is built around intraday structure — what you can actually see forming on the chart and in the order book right now.
That process starts on higher timeframes. You mark key areas: support and resistance zones, obvious reversals, long consolidations, sharp accelerations. Then those reference points are carried down to the minute chart and into the order book. At that point, the question shifts from "where is the market going overall?" to "what are participants doing around this level right now?"
Local highs and lows act as liquidity pools. Stops cluster above and below them, along with opposing limit orders. Many scalping scenarios revolve around how price attacks these zones — whether liquidity is taken and price snaps back into the range, or whether the impulse continues and a new range forms.
But the chart alone only gives you two dimensions: price and time. For scalping, you need a third dimension — volume. And that dimension comes from analyzing the order book. Large resting orders provide real support or resistance, shape how price moves, and act as a filter for deciding which trades are worth taking and which aren't.
Until these reference points are clearly mapped, every trade is essentially a jump into the unknown, with a real chance of crashing. Once structure is defined, though, the scalper stops moving blindly. Decisions become intentional: from level to level, from liquidity pool to a size order, already knowing where it makes sense to press, and where it's smarter to slow down and accept a controlled loss.