
Contents
What really are chart patterns?
One of the hardest parts of trading is to decide where to start paying attention. Price is always moving, and without a clearly defined structure, it's easy to base your trades off of noise rather than valuable data. Traders need a way to narrow the field — to identify areas where a meaningful decision is likely to happen, and where risk can be defined in advance.


Chart patterns help you solve that very problem. They organize price action into recognizable structures that reflect how buyers and sellers are interacting around key levels. Instead of watching every tick equally, patterns highlight zones where pressure is building, balance is forming, or control is starting to shift.
In this article, we look at chart patterns as a practical tool for making sense of market behavior and structuring your trades. We'll focus on what these patterns represent, how their meaning changes across timeframes, and how traders use them to frame scenarios — defining areas of interest, risk, and potential movement — before committing capital.
At the core, every pattern comes down to one of two situations. Either one side is actively pressing — say, buyers pushing up, sellers leaning on price — or the market is stuck in balance, chopping around as positions get built and unloaded. In the first case, you're watching a tug-of-war: price pushes into a level, gets hit, pulls back, tries again, and eventually either breaks or fails. In the second case, no one's really winning… yet. Price just compresses as volume rotates back and forth, and the market waits for someone to step in with enough size to force a move. As these situations repeat often enough, they start to leave familiar shapes on the chart.
The same pattern can mean very different things depending on where it shows up. On higher timeframes — daily, weekly — you're usually looking at the footprint of really big players. That's longer-term positioning, real size, capital that can stay exposed for weeks and months. On lower timeframes — 4H, 1H, 15m and below — patterns are more about intraday order flow: they reflect where speculative, short-term liquidity is right now, where stops are stacked, where price is pausing before the next push. That's why context matters so much. A flag on the daily and a flag on the 5-minute might look the same, but they may not be driven by the same participants or the same logic.
A chart pattern on its own is not a trade signal. It doesn't tell you "buy here" or "sell here." What it does is give you a clean framework for planning your trades. It helps you mark out where a reaction would make sense, where you'd clearly be wrong, and what kind of move you might be playing for if price does what you expect.
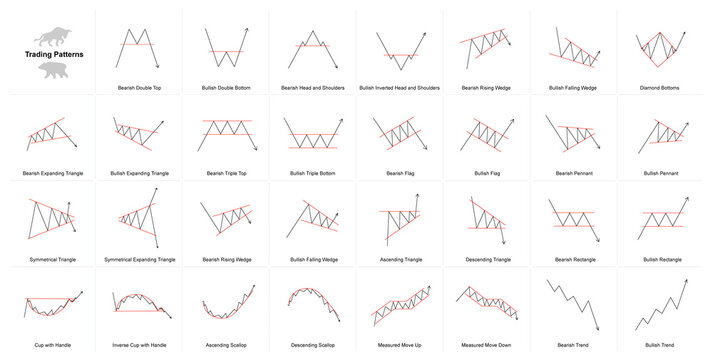
Common Chart Patterns and the Logic Behind Them
When you strip any chart pattern down to its core, it always comes down to the same question: who's in control of price right now, why they're in control, and where that control might break. That question applies not just to the shape you see on the chart, but to the context around it — what led into it, how price behaved before, and what kind of participation is driving it.
With that in mind, let's walk through some of the most common patterns traders actually use. One quick note upfront: every pattern works both ways. There's a bullish and a bearish version of each one of them. In all cases, the logic remains the same — only the direction flips.

Continuation Patterns: When the Market Pauses, Not Reverses
Let's start with continuation patterns — these show up when a strong, healthy trend is in place and the market takes a breather before pushing further. Once a continuation pattern forms, price doesn't reverse — it just slows down to take a healthy bounce. During that, trend momentum usually cools off, volatility may drop (alongside volume), and things go quiet for a bit — but the underlying intent doesn't really change. So, think of these patterns as rest stops rather than turning points. Let's go through some of the go-to ones.
The Flag
A flag is a continuation pattern that usually forms right after a sharp impulse. Price rips in one direction, then pulls back slightly against that move and starts chopping in a tight range. On the chart, it often looks like a small slanted channel or a simple box drifting against the trend.
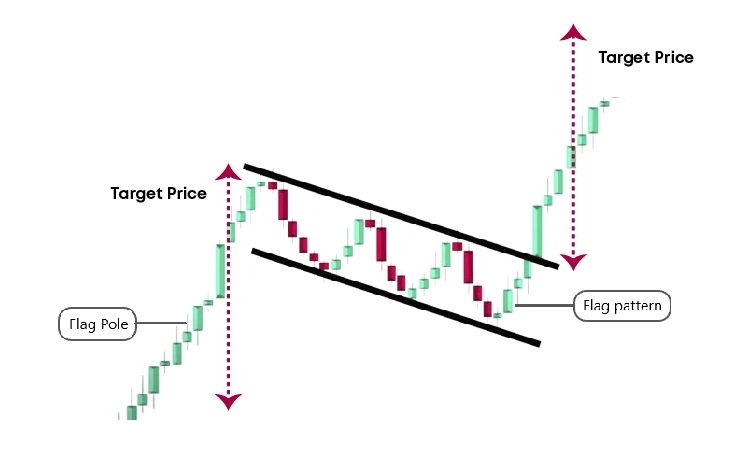
What's happening under the hood is pretty straightforward: early participants are taking profit after the impulse, and late participants use the pullback as a chance to get in. Sellers may try to push price back, but the key detail is that they can't actually flip the structure. The pullback happens, but it's usually shallow. Swings get smaller, volatility fades, and volume inside the flag usually dries up. That's the tell: the market isn't accepting lower prices — it's just cooling off.

As long as price holds inside the flag and doesn't break against the main move, continuation remains the default scenario. Confirmation doesn't come from the pattern alone, but from how price behaves inside it: what happens in the order book, whether aggressive selling actually moves price, how volume reacts on attempts lower. If pressure can't expand the range, then odds favor another push in the original direction.
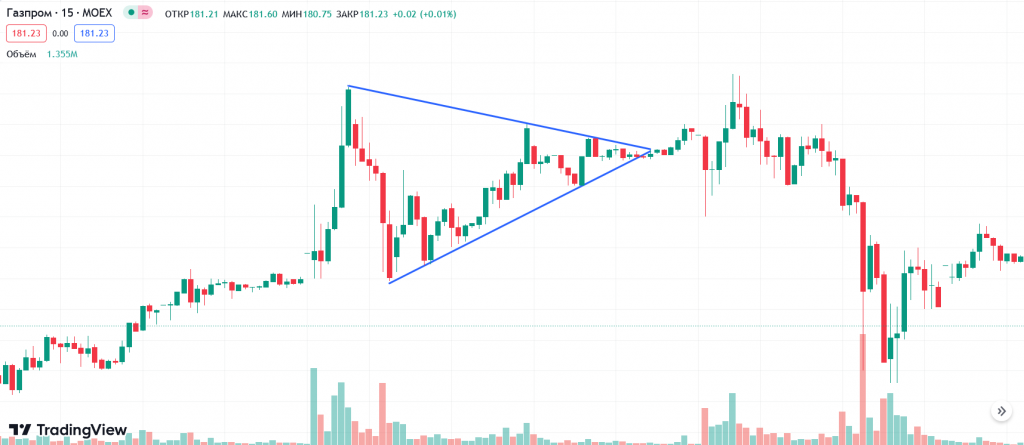
The Pennant
A pennant is basically a tighter, more compressed version of a flag. Instead of drifting sideways or slightly against the trend, price snaps into a converging triangle almost immediately after the impulse. Each push gets shorter, and the range contracts really fast.
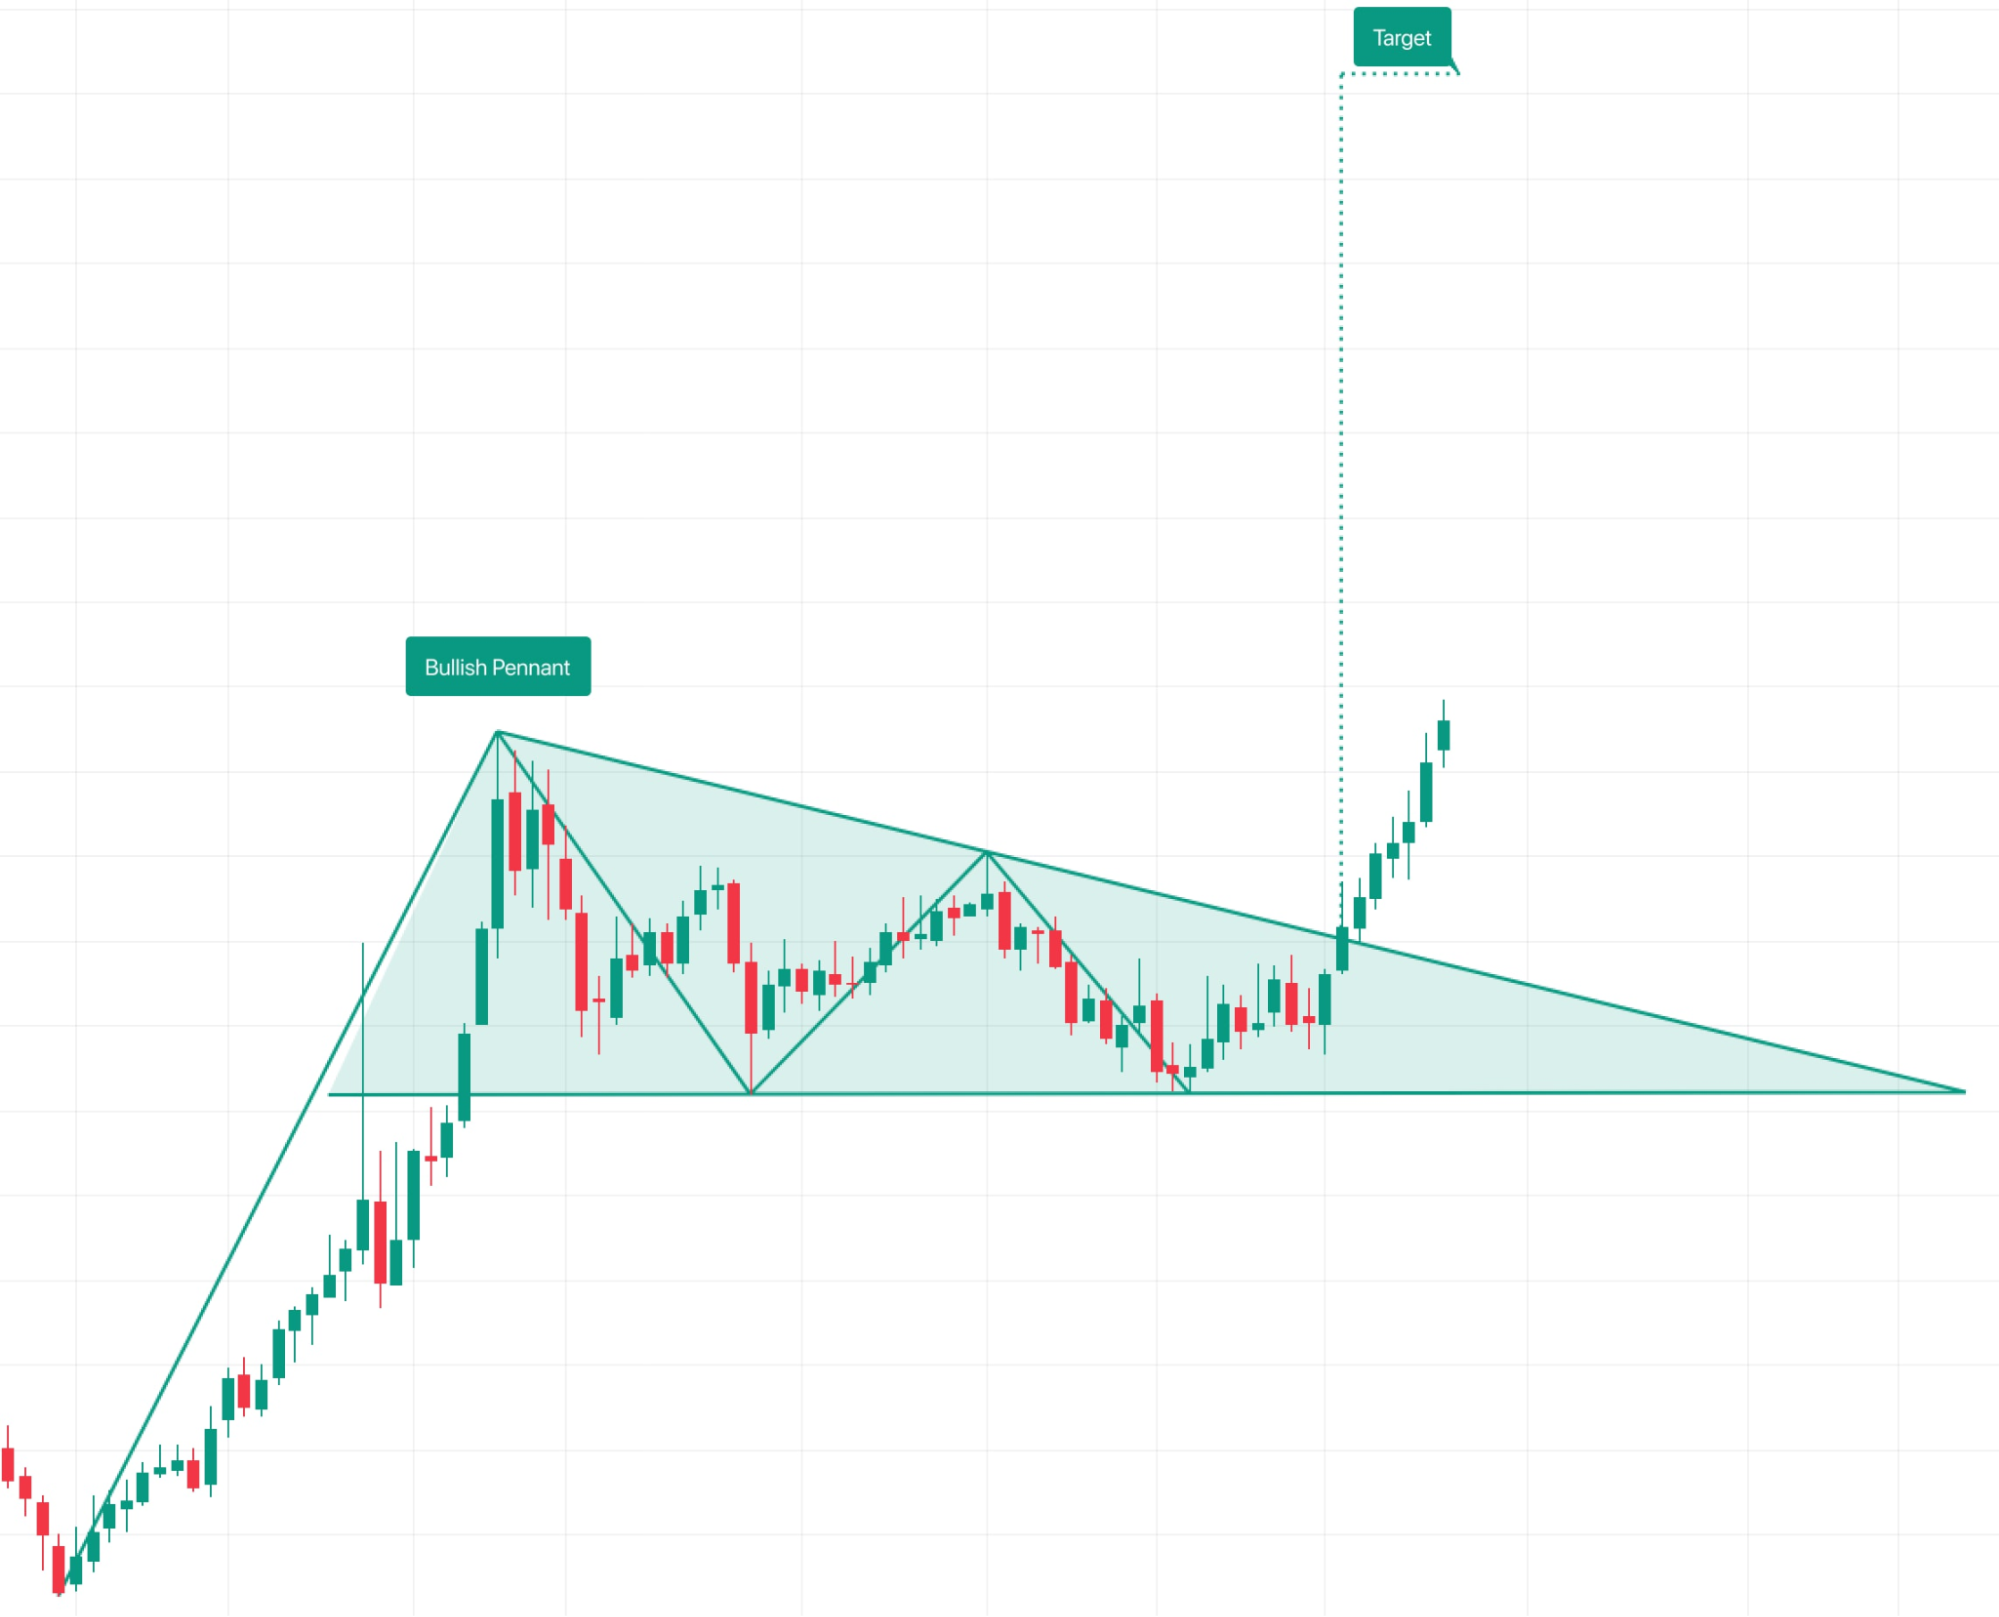
From a market logic standpoint, it's the same kind of pause before another leg — just more aggressive in time. The market goes straight from expansion into compression. Both sides step back, activity fades, decisions get deferred until price is forced to resolve.
As the pennant forms, you'll usually see volume bleed out, with less and less effort required to move price inside the structure. That compression builds tension. And because the market just came off a strong impulse, the release often happens fast. In practice, the tighter and cleaner the pennant, the more explosive the break tends to be.
Ascending Triangle
An ascending triangle is built around a very simple structure: a flat resistance level on top and a series of higher lows sort of pressing up into it. Price keeps testing the same 'ceiling', while every pullback gets bought earlier than the last one, gradually squeezing price upward.
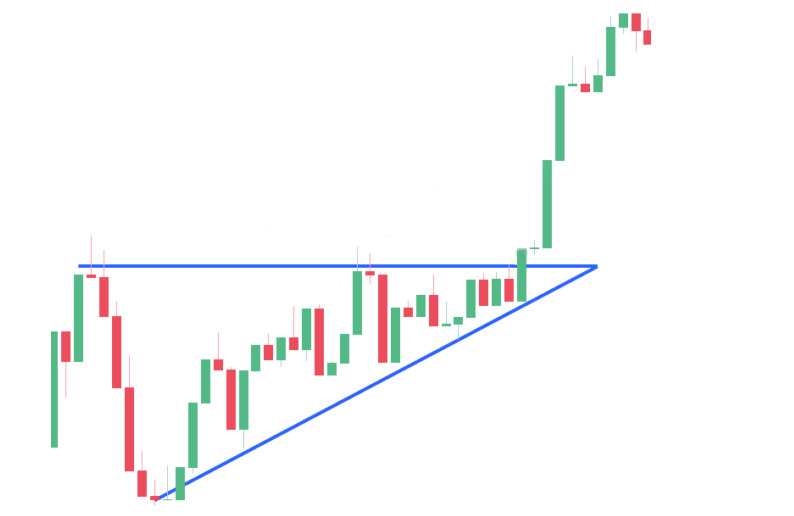
What's happening underneath is a slow shift in control. Sellers are defending a fixed area, repeatedly offering supply at the same price. Buyers, meanwhile, are getting more aggressive. Each dip gets absorbed faster, and at higher prices, which tells you demand is willing to step in sooner and sooner. The market is simply being pushed upward into resistance with no willingness to collapse.
From a market-structure point of view, this is just accumulation with limited supply. As long as resistance holds, price action here can look fairly neutral or even boring. But under the hood, there's mounting pressure. Eventually, the supply sitting at that level runs out or steps aside, and when it does, price doesn't need much effort to keep pushing through.
Descending Triangle
A descending triangle is — you guessed it — the same story, just flipped. Here you've got a flat support level being defended by buyers, while highs keep stepping down with each bounce.
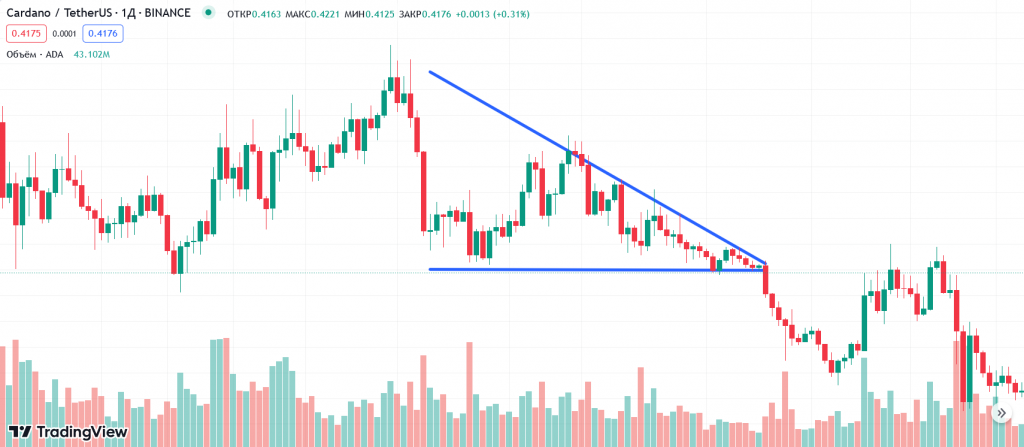
In this case, sellers are the ones gaining ground. Buyers manage to hold the same level again and again, but each bounce gets weaker. Upside attempts stall quickly, and sellers step in earlier every time, leaning on price from lower and lower levels. That tells you supply is becoming more confident, while demand is struggling to lift the market.
Eventually, that support starts to crack. Once buyers can't absorb the pressure anymore, price accelerates lower, often faster than expected.
You'll frequently see descending triangles during distribution phases, where a larger participant is unloading size without letting price recover properly. The structure looks calm on the surface, but underneath, inventory is being shifted.
Symmetrical Triangle
And there's the symmetrical triangle — the most neutral of the three. Highs keep getting lower, lows keep getting higher, and price compresses into a tightening range, like a spring being slowly wound up.
This usually shows up when neither side has a clear advantage. Buyers can't push higher, sellers can't push lower, and because of that, both sides gradually reduce aggression. As the range tightens, volume typically dries up, which is a classic sign that the market is waiting for a catalyst — like a liquidity influx, or a news driver.
Here, direction isn't defined by the pattern itself. Everything depends on how price leaves the structure. A clean break higher can kick off a bullish impulse. A break lower can do the opposite. And just as often, especially in crypto, you'll see fake breaks designed to grab liquidity before the real move starts in the other direction.
Because of that, triangles are less about predicting and more about monitoring. Once price starts to resolve, it's worth paying close attention to the order book and the tape. Is there real follow-through? Are aggressive orders actually moving price, or getting absorbed? That's where you separate a genuine breakout from a liquidity grab.

Reversal Patterns: What the Shift Looks Like on the Chart
Reversal patterns start showing up when the market keeps trying to behave the way it used to — pushing in the direction of the trend — but those attempts stop producing the same results. Price still makes an effort to continue, but each push feels heavier, slower, and less convincing. New highs or lows become harder to print, reactions grow sharper with each attempt to break through. You can feel how the overall market rhythm begins to change. Let's go through some of the most common reversal patterns.
Head and Shoulders
The head and shoulders is probably the most well-known reversal structure, largely because it's easy to spot once it's fully formed. It consists of a major high (or low) with two lower highs (or higher lows) to its either side. The middle high/low is therefore called the Head, and the adjacent ones — the shoulders. And the support/resistance level connecting the three is called the Neckline.
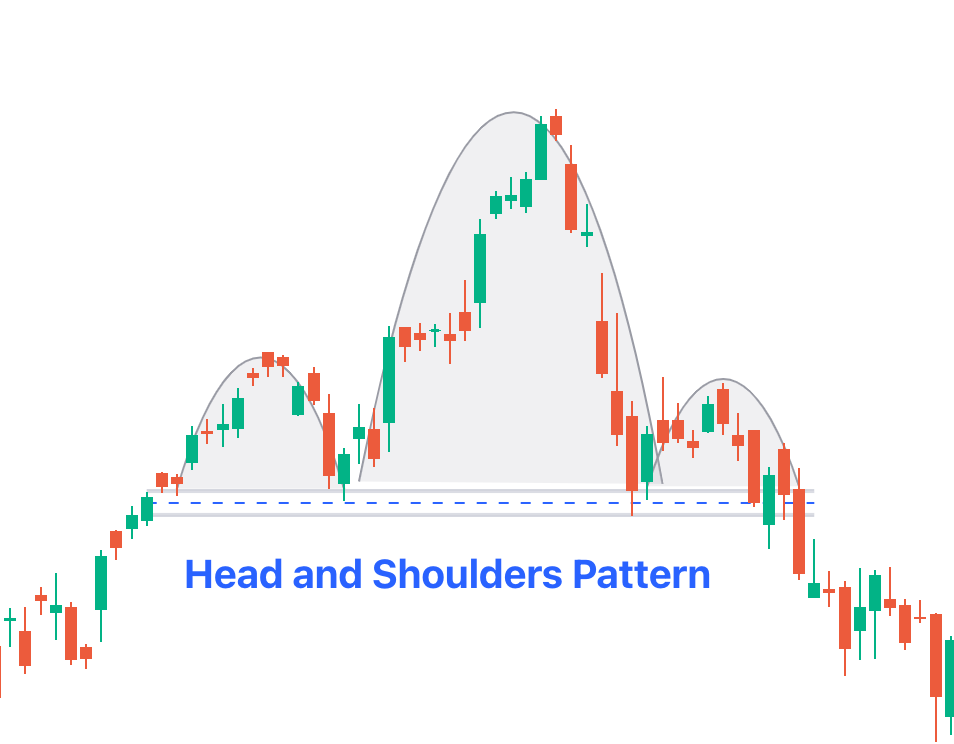
When the left shoulder forms, everything still looks fine. The trend is intact, price pulls back in a normal way, finds support, and pushes again. There's nothing in that leg that feels out of place, which is why most traders don't pay it much attention in real time.
Then comes the next push — the head. On paper, this is a new extreme, so technically the trend is still doing what it's supposed to do. But if you watch closely, you'll see that there's something different going on here. The move often takes longer, looks less impulsive, and requires more effort to get to the high. More importantly, the reaction after the extreme is weaker than what you've seen earlier in the trend. Price gives ground faster than expected.
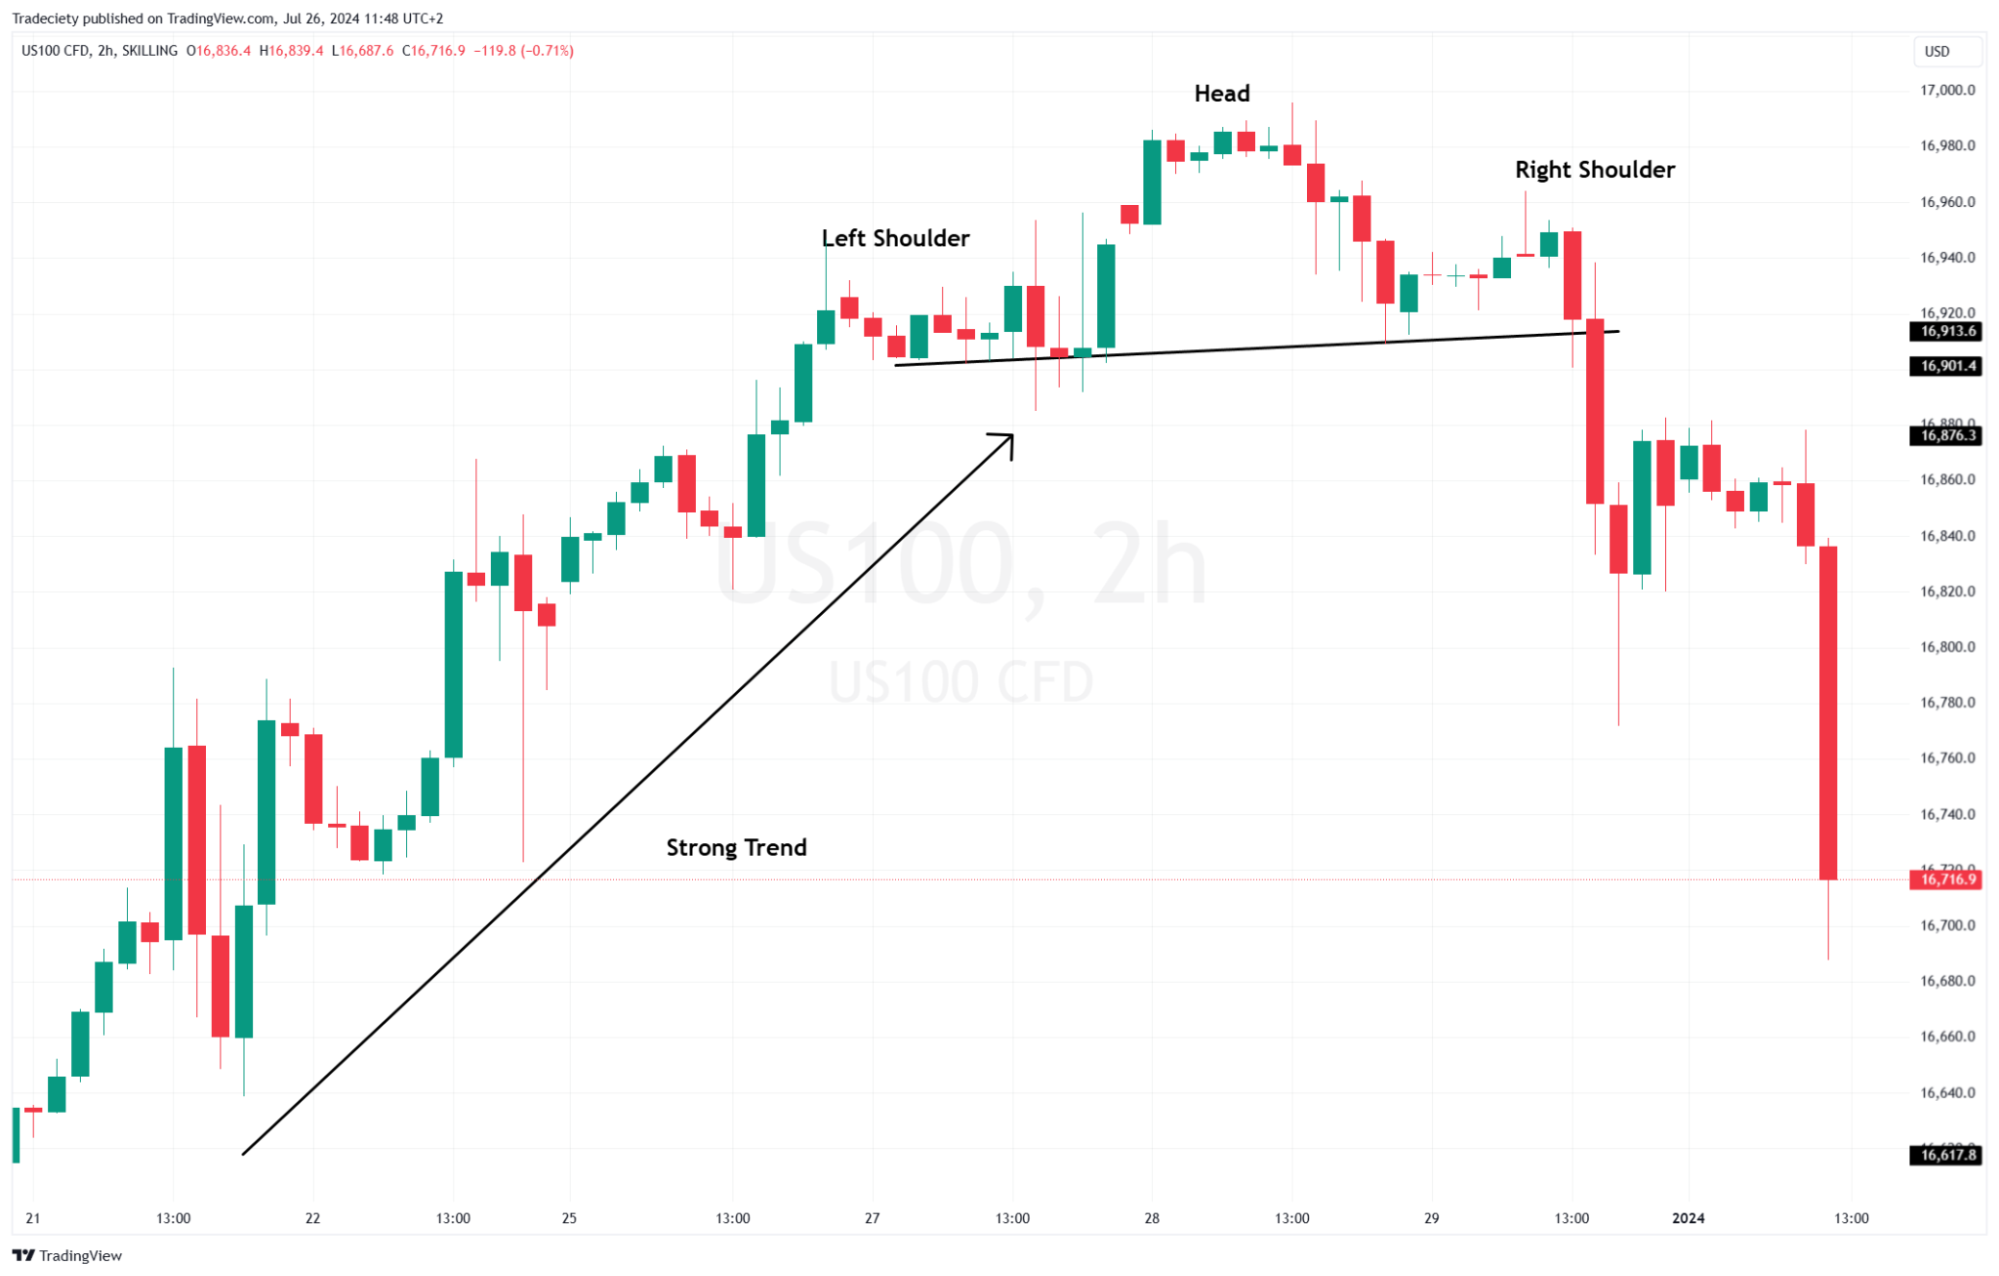
By the time the right shoulder forms, the change in behavior becomes hard to ignore. The market tries to push again, but either fails to reach the level of the head or tags it briefly without any real follow-through. There's no pressure behind the move. At that point, it's clear the market can't sustain the pace it had before.
The actual trend change becomes visible once the neckline breaks. As long as price holds above it, the old structure still technically exists. But after the break, there's a shift in the very character of the movement. Pullbacks get deeper, recoveries get weaker, and the overall flow flips. That's why day traders and scalpers usually focus less on the shoulders themselves and more on how price behaves around the neckline — that's where the transition really happens.
Double Top
A double top is one of those patterns that looks simple on the chart, but only really makes sense once you start paying attention to how price gets there. At its core, you're watching the market try — twice — to push through the same area.
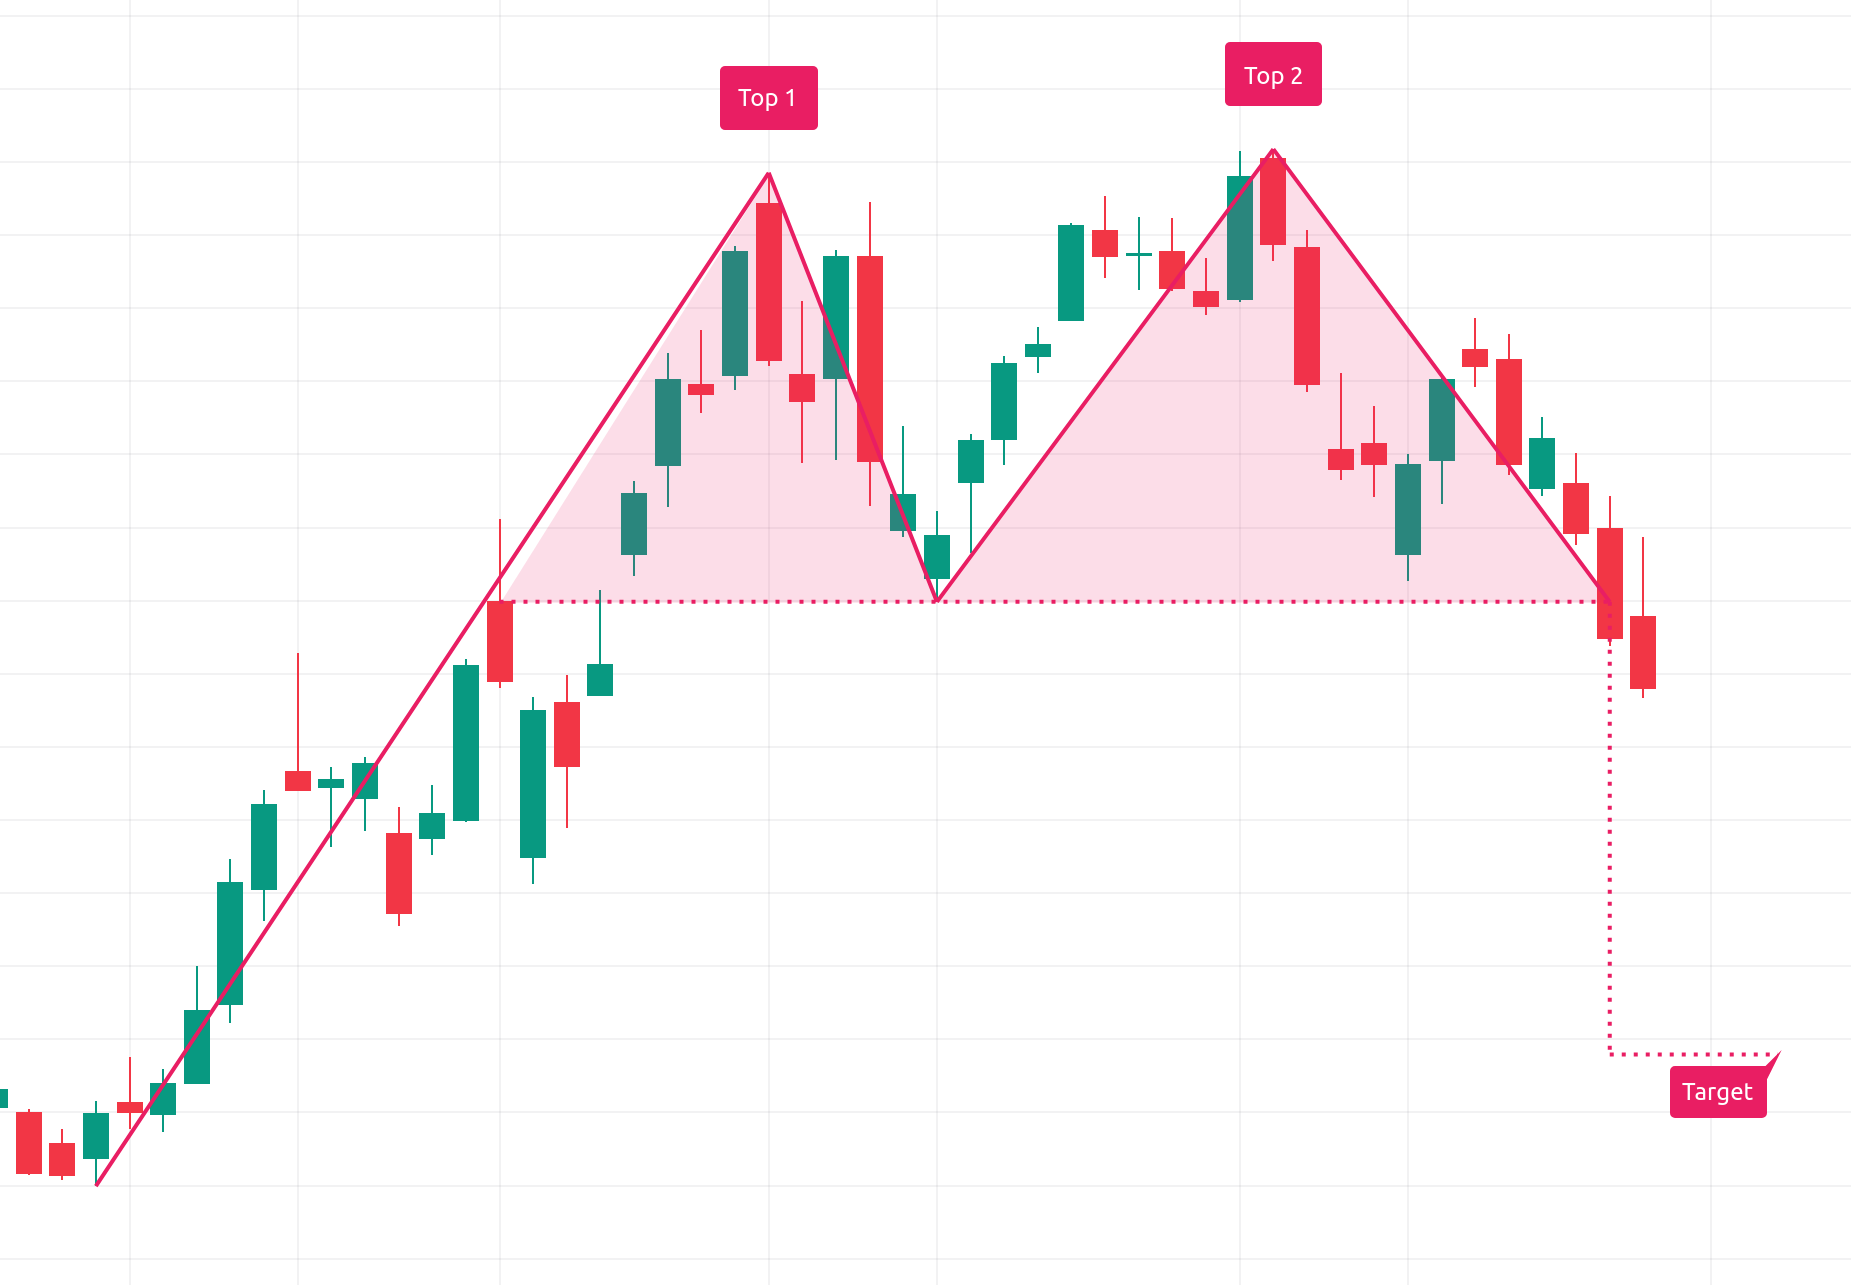
The first attempt usually looks healthy. Price moves up with momentum, candles expand, and nothing really stands in the way until the high is printed. There's no obvious sign of trouble yet. After a pullback, price comes back for another go — and this second approach is where things get interesting.
If the move into the level feels heavier this time — talk slower pace, more chopping, less follow-through — that's your first hint that something has changed. The level itself might still be holding, but the effort behind the push is clearly weaker. That difference in quality is what matters here. A second test on its own doesn't tell you much, but a second test that struggles to get anywhere usually does.
As long as price stays above the low between the two highs, the uptrend is technically still intact. Nothing has broken yet. But once that level gives way, it's a clear sign that the old support isn't doing its job anymore. From there, the market often starts behaving differently — pullbacks get deeper, bounces get weaker.
Double Bottom
A double bottom is the same idea, just flipped. Instead of watching price fail twice at the highs, you're watching it fail twice on the way down.
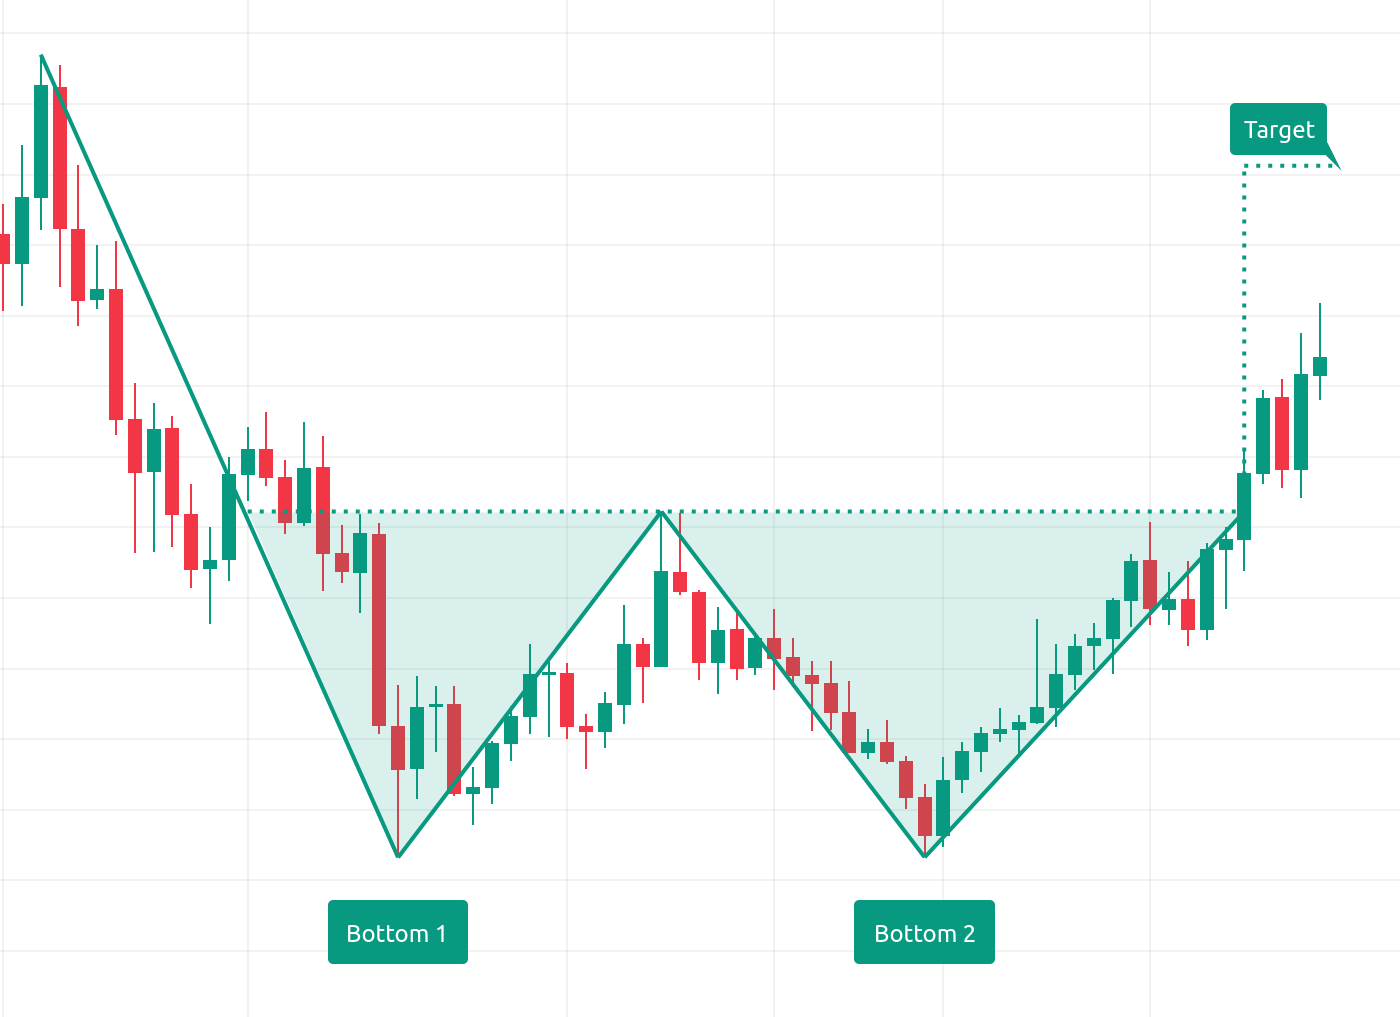
The first low is often messy and emotional. Selling accelerates, stops get hit, and price drops fast. After a bounce, the market tries to push lower again — and, once again, the second attempt tells the real story.
If that second push can't make a new low and price quickly pops back into the range, it's a sign that sellers are running out of steam. The market is basically asking, are there still sellers down here? — and not getting a convincing answer. You'll usually feel the difference in how price moves: less urgency on the way down, quicker reactions upward, less pressure overall.
Confirmation comes when price breaks above the high between the two lows. Until then, it's just a hypothesis. Once that level is taken out, though, it's a strong indication that the downtrend has lost control and the market is shifting into a different phase.
The Wedge
Wedges are tricky because, at first glance, they often look like continuation. Price is still moving in the direction of the trend, so it's easy to assume everything is fine. But if you slow it down and look at the quality of movement, a different picture starts to emerge.
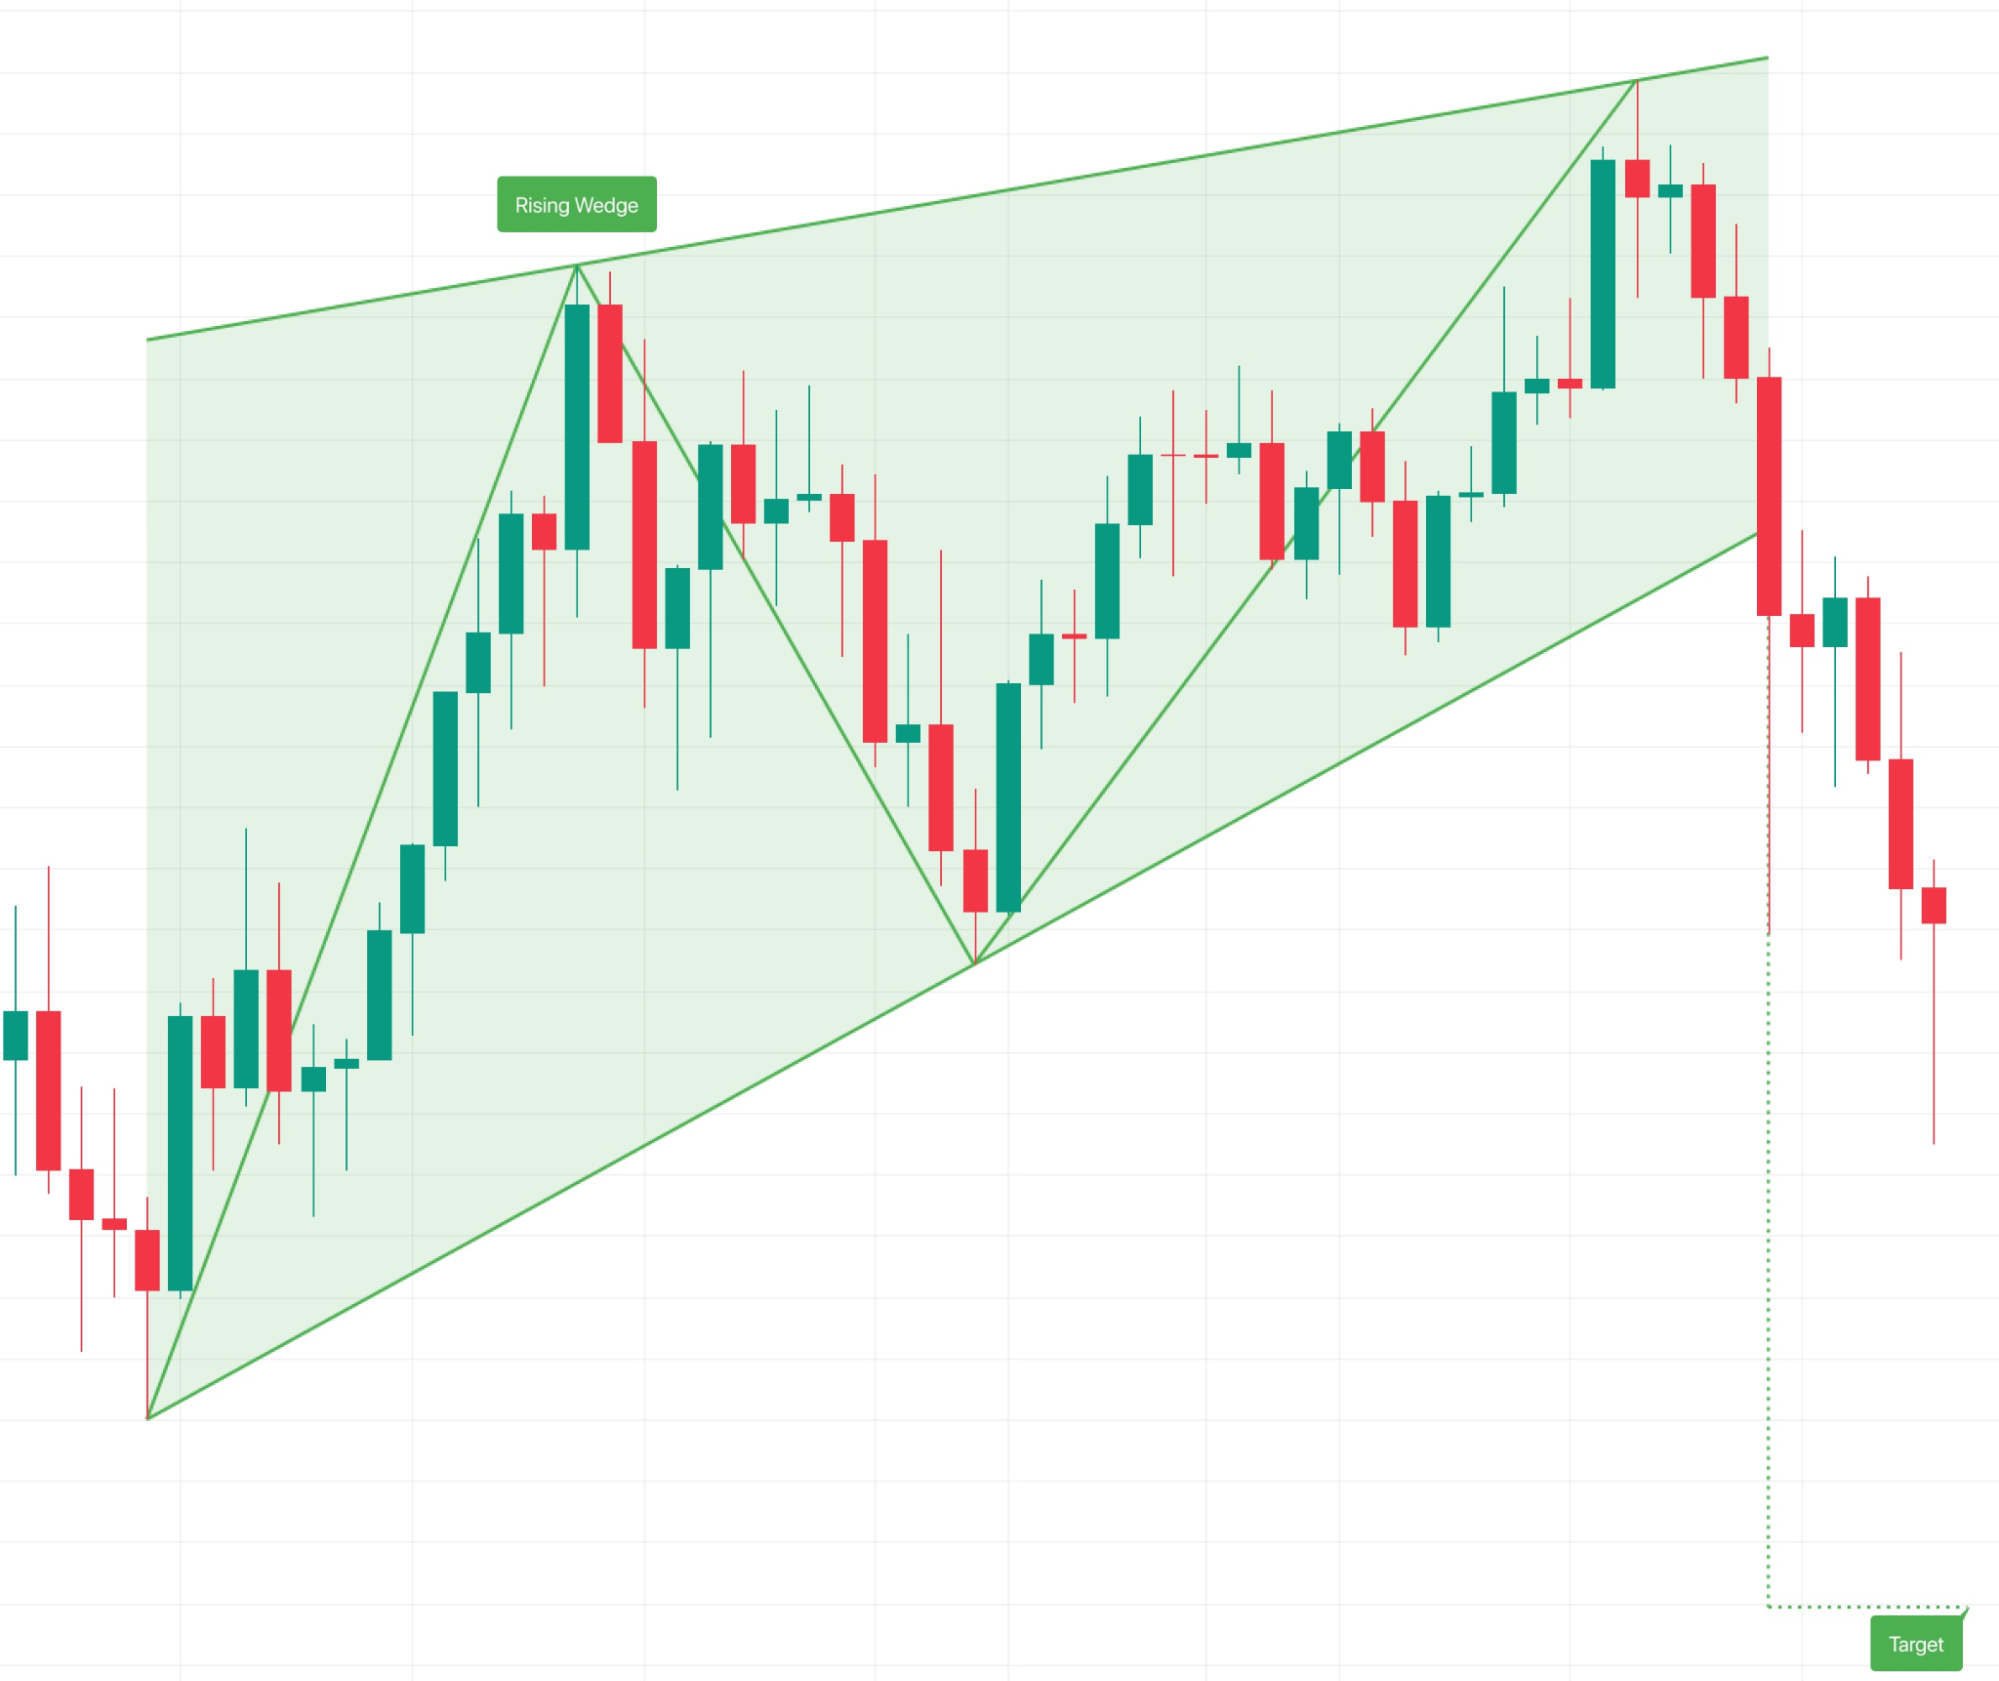
Each push covers less ground than the previous one. Impulses get shorter, reactions get choppier, and momentum bleeds out over time. Price keeps drifting, but it feels like it's doing more work for less result. That's usually your first hint that something has changed.
A converging wedge against the trend reflects exactly that state. The market hasn't flipped yet, but it's no longer able to move efficiently in the same direction. Pressure is building, sure, but instead of releasing into continuation, it starts to turn… inward. When the reversal finally comes, it's often less about a single explosive candle and more about a gradual change in how price moves — shallower pullbacks and stronger reactions in the opposite direction.
Across all reversal patterns, the common thread is this: the shape itself isn't the signal. What matters is the change in behavior. The market stops advancing in the direction of the trend with the same confidence it had before, and that shows up in the quality of impulses, the speed of moves, the depth of pullbacks, and often in how volume behaves on the tape and in the order book. The pattern simply gives those changes a visual outline.
Rare & Exotic Patterns
Beyond the usual flags, triangles, and reversals, there's a whole category of so-called 'exotic' patterns that show up much less often and tend to divide opinion. Some traders swear by them, others roll their eyes the moment they're mentioned. That reaction is understandable — these patterns are harder to spot, easy to misread, and most times completely useless out of context.
Still, when they appear in the right place and on the right timeframe, they can hint at something you don't always get from simpler structures: a deeper shift in market phase, or preparation for a larger move that hasn't revealed itself yet.
Cup and Handle
The cup and handle gets its name from how it looks. Price first forms a wide, rounded bottom (or top) — not a sharp V, but a slow, patient recovery, more like a wide U. That's the "Cup." After price works its way back toward resistance, it pulls back slightly again, forming the "Handle."
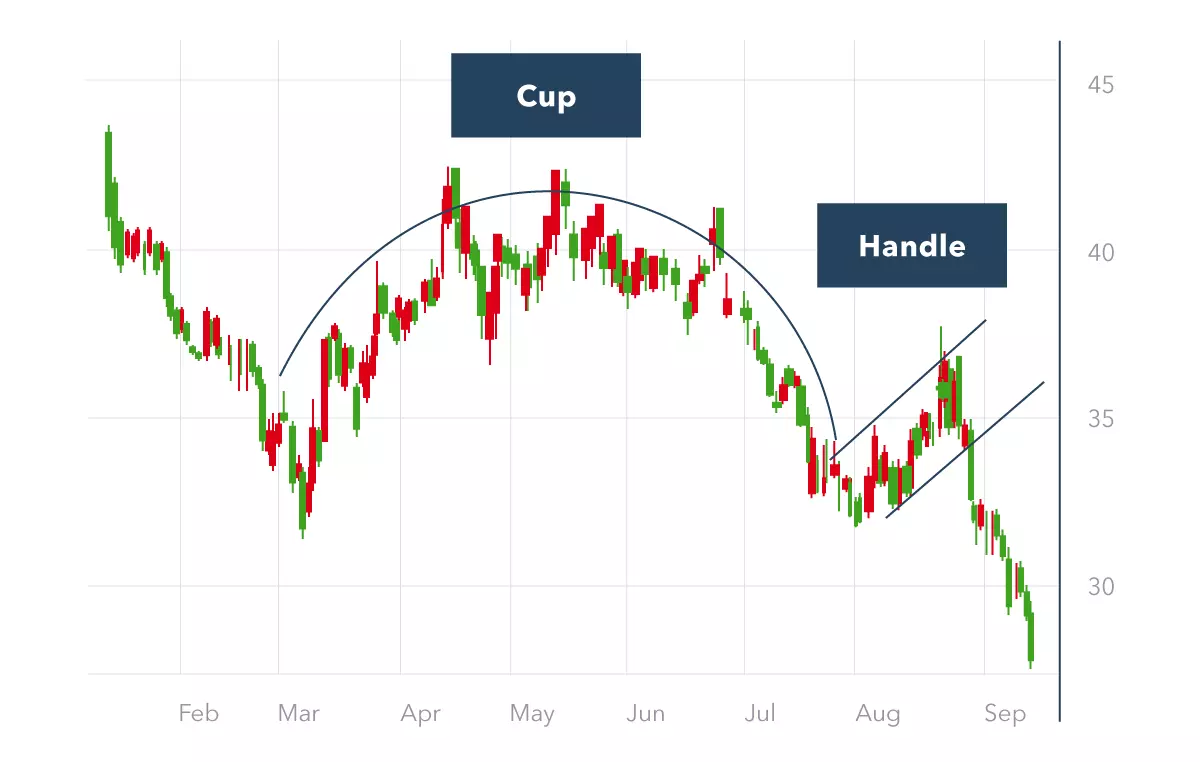
What this usually tells you is that the market is coming out of accumulation, but without urgency. Sellers are gradually losing control, yet buyers aren't rushing in either. Instead of a breakout, you get acceptance — price spends time near resistance, testing it, getting comfortable there.
The handle is often the last shakeout. Late buyers get impatient, weak longs get cleaned out, and liquidity builds just below the level. If price then breaks out with expanding volume and doesn't immediately slip back inside, you can expect pretty strong continuation to follow.
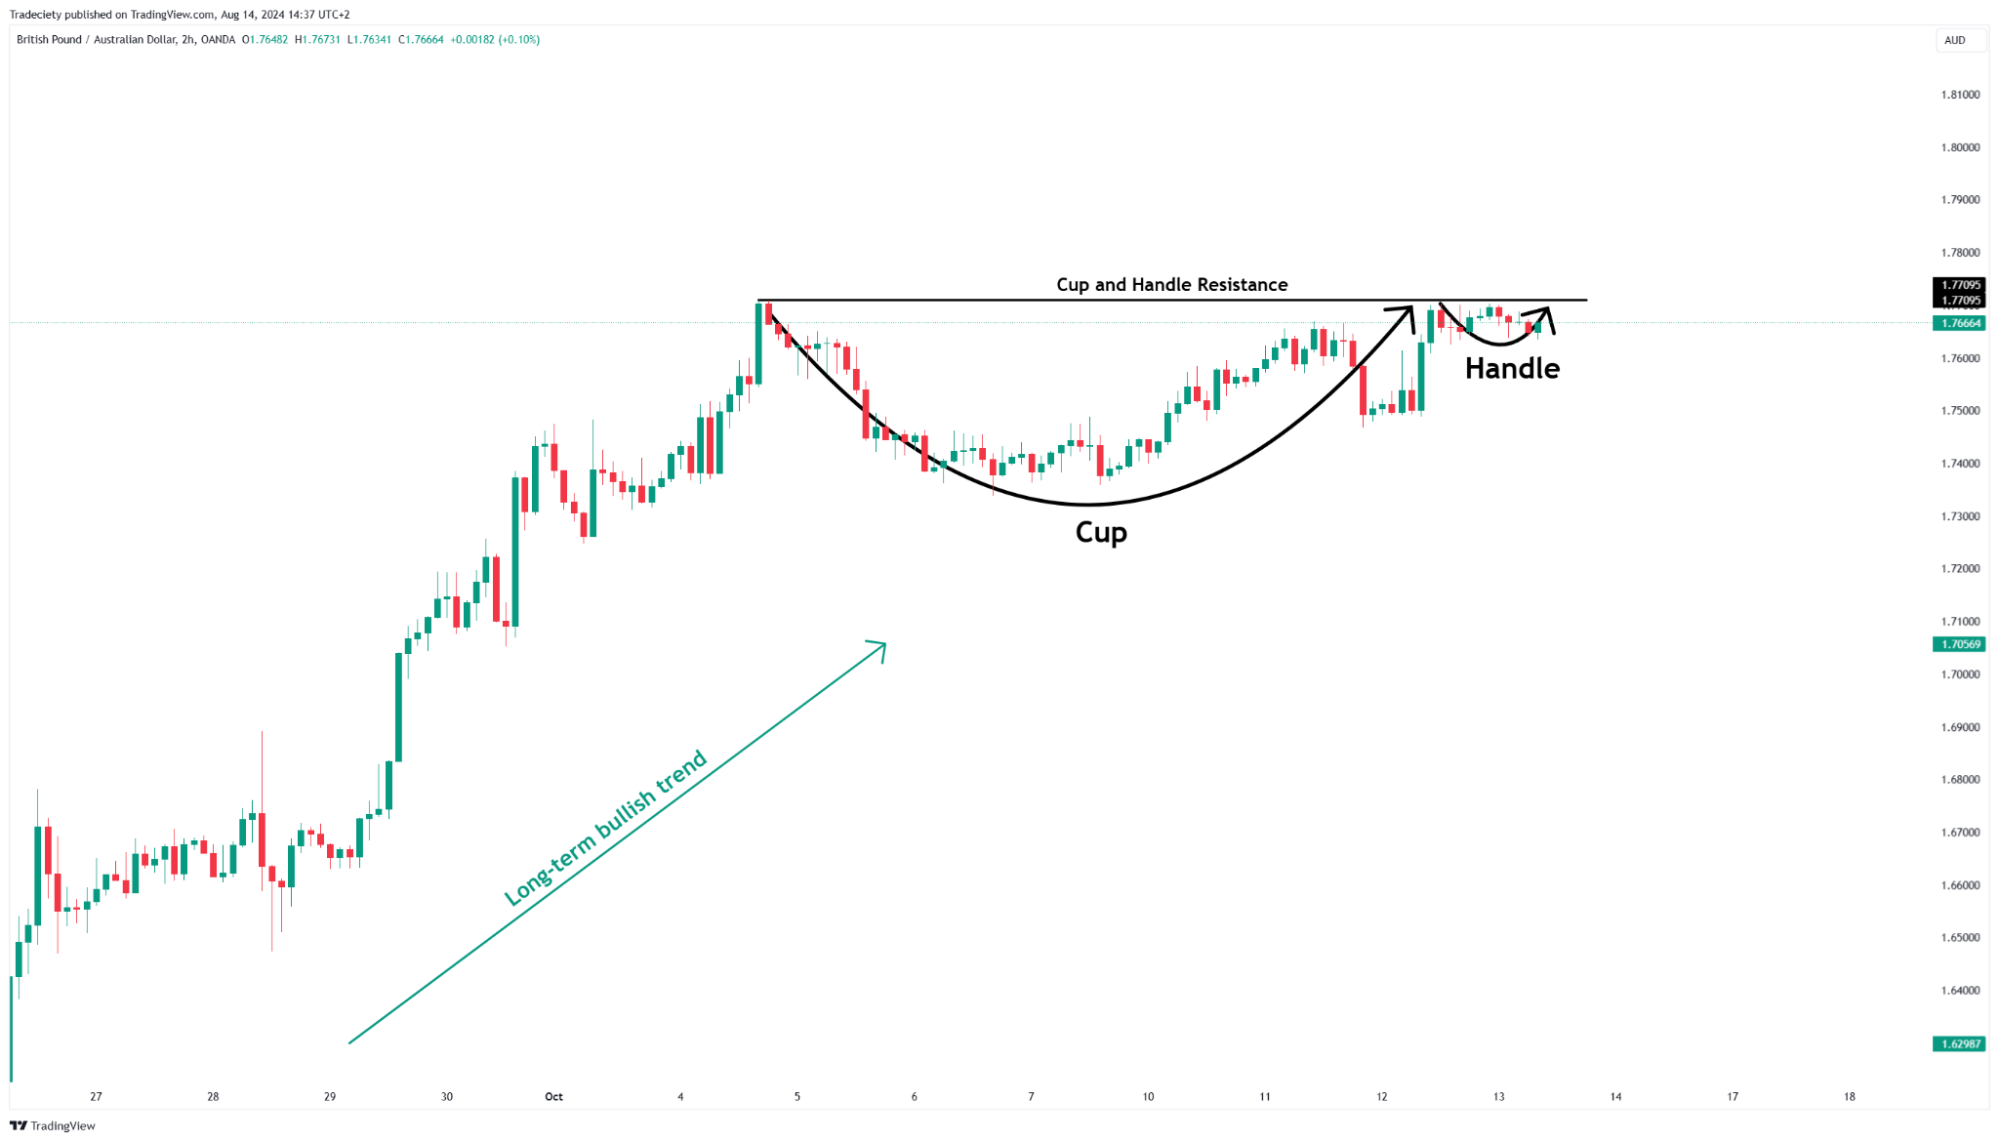
Because this pattern takes time to form properly, it makes the most sense on higher timeframes — daily or 4H charts, especially within broader uptrends. A common healthy version looks like this: strong move up, slow rounded pullback, recovery, brief consolidation, then resolution.
On very low timeframes, though, cup-and-handle shapes are often just noise. In thin liquidity or around news, they tend to fail quickly, so treating them seriously on minute charts is usually asking for trouble.
The Diamond (Top or Bottom)
The diamond is one of those patterns that almost looks too neat when it works — and that's exactly why it's so rare. Visually, it starts with expanding volatility: highs get higher, lows get lower. Then, over time, that expansion contracts again. The range widens, then tightens, forming a shape that really does resemble a diamond.
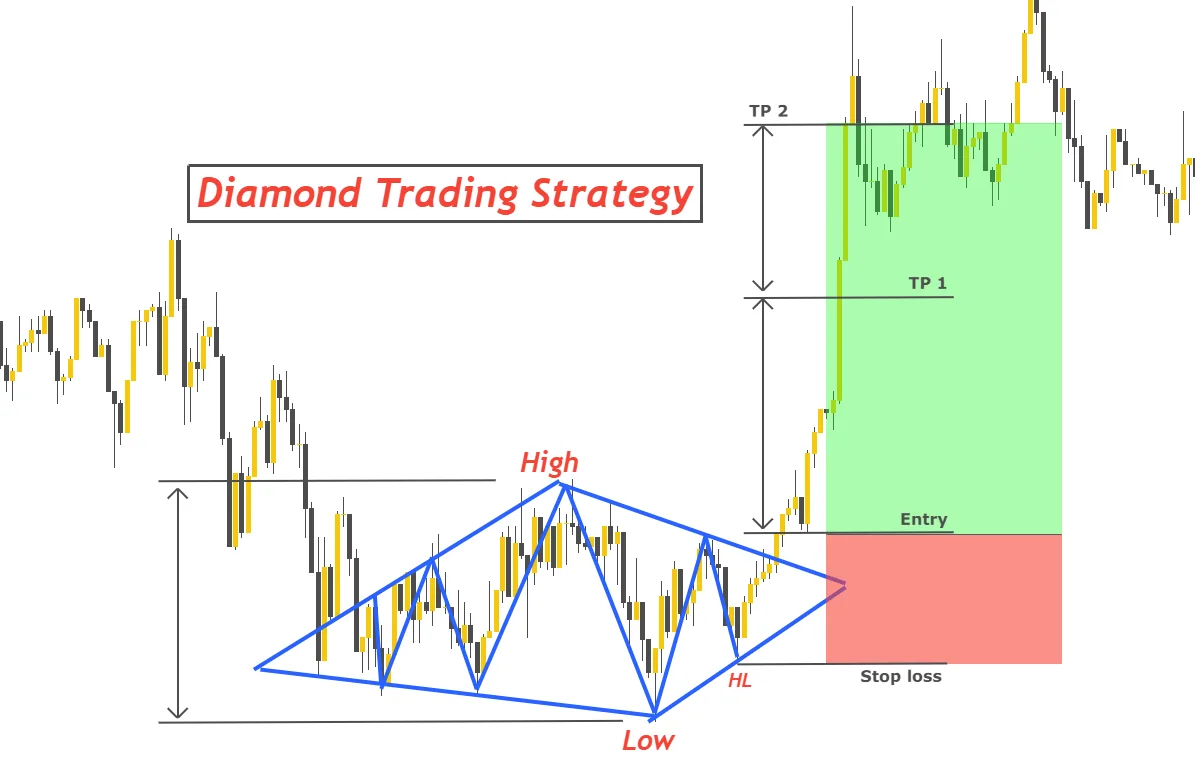
Psychologically, this reflects a market in a state of conflict. First, you see aggressive participation on both sides — sharp swings, fast moves, wide ranges. Nobody's in control. Then that chaos starts to burn itself out. You'll see volatility compressing and price itself stabilizing, as the market drifts into a temporary balance.
The important part isn't the shape itself, but how price exits it. The break from that compressed zone often marks a decisive shift — frequently a reversal, especially if the pattern appears after a long, extended trend.
Diamonds are best watched on higher timeframes — daily or higher — where the volatility expansion and contraction actually mean something. On lower TFs, the same shape can easily be random chop dressed up as a pattern.
Note that these exotic patterns shouldn't be the backbone of your strategy. They're a bit too rare and too context-dependent for that. But as a filter, especially on higher timeframes, they can be pretty useful. They can tell you to slow down, zoom out, and reassess whether the market is transitioning into a different phase.
As with everything else in trading, the value isn't in the name of the pattern. It's in whether the behavior underneath actually supports the story you're telling yourself.
Chart Patterns in Scalping: What Actually Matters
As a wrap-up, it's worth talking about patterns in scalping and intraday separately, because on minute and second charts they behave very differently than they do on higher timeframes. Down here, a pattern isn't a "thing" in its own right. It's a byproduct. A side effect of liquidity moving around.
On lower timeframes, price isn't drawing shapes for your convenience — it's reacting to orders being placed, pulled, filled, and defended. So looking at patterns in isolation, without understanding what's happening inside them, is mostly pointless. Without order-flow context, a pattern is just an empty outline.
Any pattern you see is essentially a footprint of volume redistribution. While price is trading inside that structure, the market is in temporary balance. Some traders are taking profit, some are building their new positions, some are sitting on their hands waiting for resolution. Nothing decisive is happening yet — and that's exactly why the range exists.
This is why scalpers don't treat pattern boundaries as abstract lines. Those levels usually coincide with liquidity zones. Just beyond them, you'll often find stop orders from traders playing the range, limit orders from those defending levels, and resting orders from traders waiting for a breakout. As long as that liquidity holds, the market stays balanced. Once it starts to thin or shift, the situation changes quickly.
That's also why pattern trading in scalping requires the right tools. You need a terminal that shows you what's actually going on: order book, time & sales, and volume-based tools like bookmap, footprint charts or volume profile.
The order book shows you how balance is maintained. If large limit orders are actively defended and price keeps bouncing even under aggressive market orders, then you can assume that balance is still intact. However, if those orders start pulling, sliding, or getting 'eaten' without much reaction, that's usually the first sign the structure is weakening.
The tape tells you about intent. Is price testing a level lazily, with scattered prints and no follow-through? Or are you seeing a burst of directional trades, one after another, hitting the same side? That difference matters far more than the pattern's shape.
And lastly, volume profile and footprint help you see where the real trading happened inside the structure. If most of the volume clusters near one boundary, it often points to hidden interest and hints at how the breakout might play out. If volume is evenly distributed, the market is probably still waiting — no side has committed yet.
In practical scalping, patterns are useful because they narrow your focus. They tell you where the market should eventually show its hand. Direction, timing, and execution, however, come from order flow — from how price behaves when it reaches those boundaries.
Wrapping It Up
Let's draw the bottom line. Chart patterns aren't signal generators — they're a way to organize the market visually, to highlight key areas where something should happen. They help you anticipate decision points, structure scenarios, and plan risk ahead of time. But they don't replace reading volume and flow — especially not in fast, intraday trading.
For a scalper, the main takeaway is this: don't trade the shape without understanding what's inside it. Every pattern needs context — timeframe, market phase, liquidity conditions — and a clear plan before you put any risk on. Entry, stop, and invalidation should be defined before the market forces you to decide under pressure.