
Содержание
Reversal Chart Patterns
In this article, we’re going to walk through reversal chart patterns through the lens of order flow. We’ll focus on how these patterns form, what the volume tells us during their formation, and how large‑size orders behave as control shifts from one side to the other. For scalpers who work off the tape and the book, this is where the real edge lives. The idea is to treat each pattern as a framework for reading the flow, a container where we can spot the juciest signals. Let’s get into it.
What are chart patterns (and why we even care)
Let’s start from the obvious. Chart patterns are recurring formations on price charts that reflect how order flow is distributed over time. That’s it — footprints of how buyers and sellers interacted in a specific context. When you see a pattern forming, you’re essentially seeing the shadow cast by the order book over a period of time.
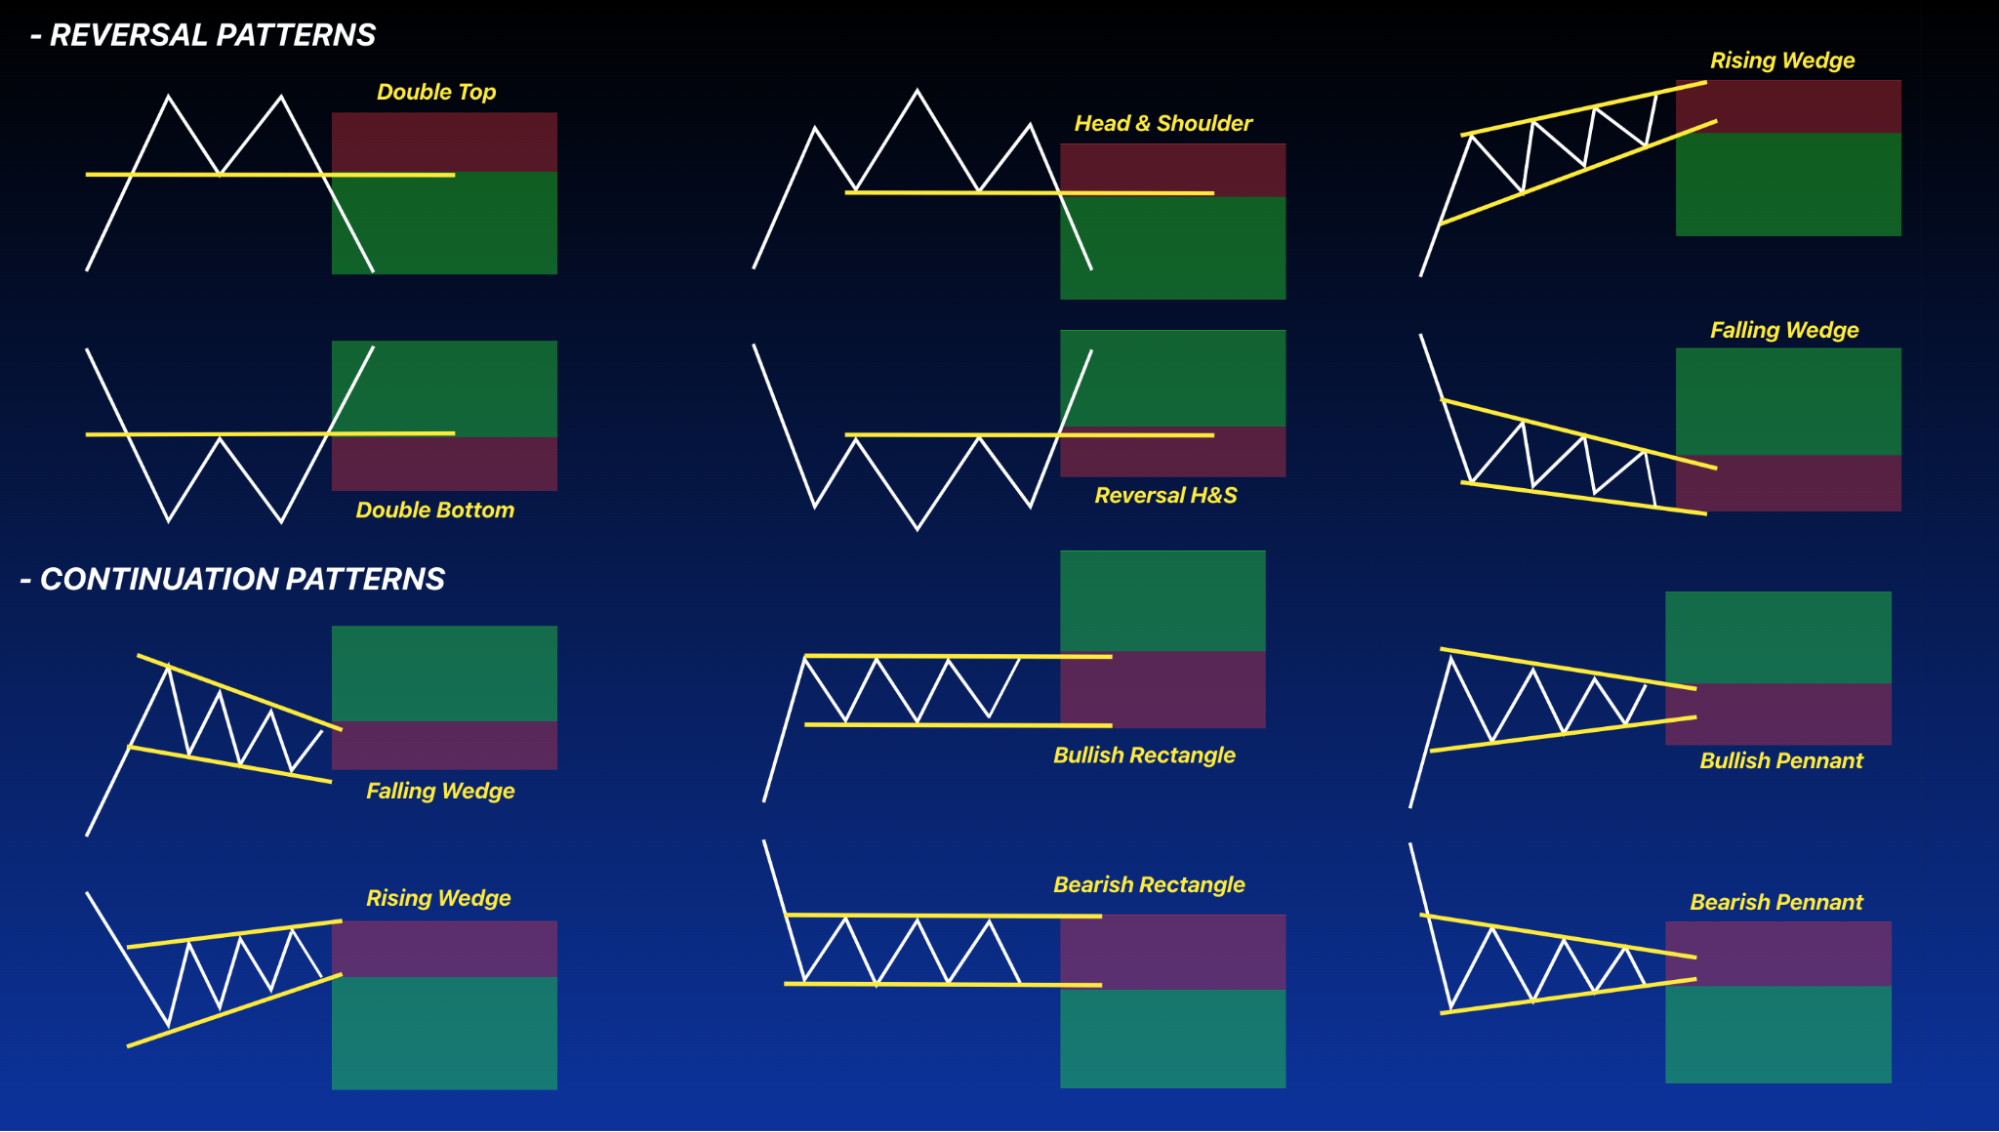
Now, if you flip through any classic textbook on technical analysis, you’ll see patterns broadly fall into three buckets. Let’s name them quickly, because it gives us a map for where reversal patterns fit in:
- Continuation patterns — pauses inside an existing move, such as flags or pennants.
- Reversal patterns — signals that the current move is likely exhausting. This is our focus here. These are structural points where the dominant side loses conviction.
- Neutral/consolidation structures — a state of price balance before expansion. Think rectangles or tight ranges. These are the battlegrounds where a new trend is born.


Now, if you come from classic TA, patterns are usually taught visually: you draw lines, look for symmetry, and wait for a textbook entry with a neat stop-loss. That’s fine for swing traders who check their screens every few hours or days. But for a scalper working off DOM and volume, that kind of approach just won’t do. By the time the "textbook" breakout confirms on an hourly candle, the impulse is often already over in our world.
For us, the shape itself is secondary. The shape is just the box we’re trading inside.
What matters is:
- Who is active inside the pattern — Is it the same aggressive player who started the move, or has the liquidity taker vanished, replaced by algorithm pinging the bid?
- Where liquidity is sitting — Is the passive liquidity stacked deep behind the pattern, baiting a breakout? Or is it thin, ready to snap?
- How aggressively it’s being consumed — Are we seeing market orders eating through the stacked limit orders slowly (absorption) or violently (initiation)?
- Whether large players are absorbing or initiating — This is the golden key. Are the large-size orders showing up as icebergs on the offer, letting price drift down to trap sellers? Or are they slamming the bid to trigger stops?
So, let’s get this straight before we go any further: In the world of intraday scalping, the pattern is not the signal — it’s the container. It’s the frame of the house. The signal is in the flow inside. The pattern tells you where to look for your target; the volume, the DOM, and the behavior of the large-size orders tell you when to pull the trigger.
We’ll discuss how to read that window for each specific pattern next.
Reversal Chart Patterns
Графический паттерн разворота полезен только вместе с контекстом: тренд, ликвидность и подтверждение на объёмах.
Before going pattern by pattern, it’s worth anchoring one idea. When we specifically talk about reversal patterns, we have to be careful, because in the world of scalping, the word “reversal” gets thrown around way too loosely.
A reversal in scalping is not a mere “price turned around,” but a shift in control. That is, from aggressive buyers to aggressive sellers, or vice versa.
And that shift never happens in a vacuum. It always shows up in:
- Volume histogram/profile – who’s stepping in, who’s stepping out
- Tape speed – acceleration or deceleration at the edge
- DOM behaviour – pulling, stacking, absorption, the sudden appearance or disappearance of large‑size orders

Now, before we dive into the specific structures, let’s think about why this distinction matters for someone trading off DOM and volume. If we’re looking at a classic head and shoulders on a one‑minute chart, we might see the right shoulder forming and think “reversal.” But if we check the DOM and see that the same aggressive buyers who lifted offers during the left shoulder are still leading the tape on the right shoulder — just with smaller size — then it’s not a reversal. It’s a trend losing steam, but control hasn’t shifted. We enter, the market chops, and the “reversal” doesn’t follow through because the dominant side never actually handed over the reins.
So when we say “reversal patterns,” we’re actually talking about structural situations where the order flow tells us that control has changed hands before the price makes its big move. The pattern on the chart is just the aftermath.
Okay, now let’s go through the key structures.
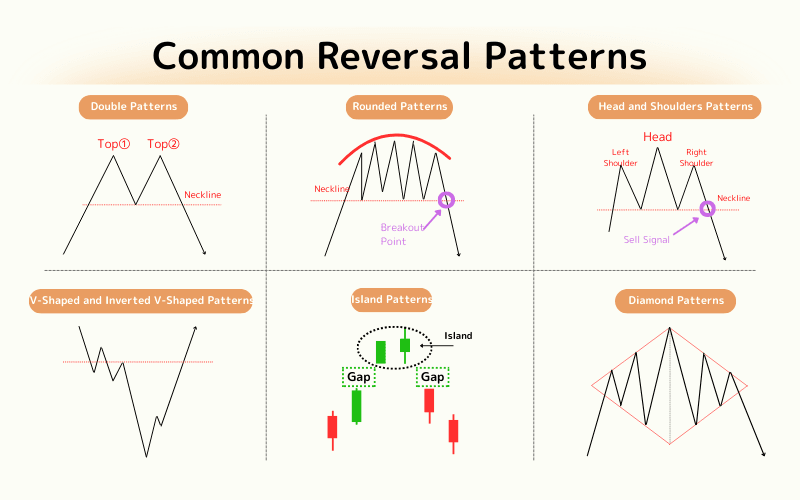
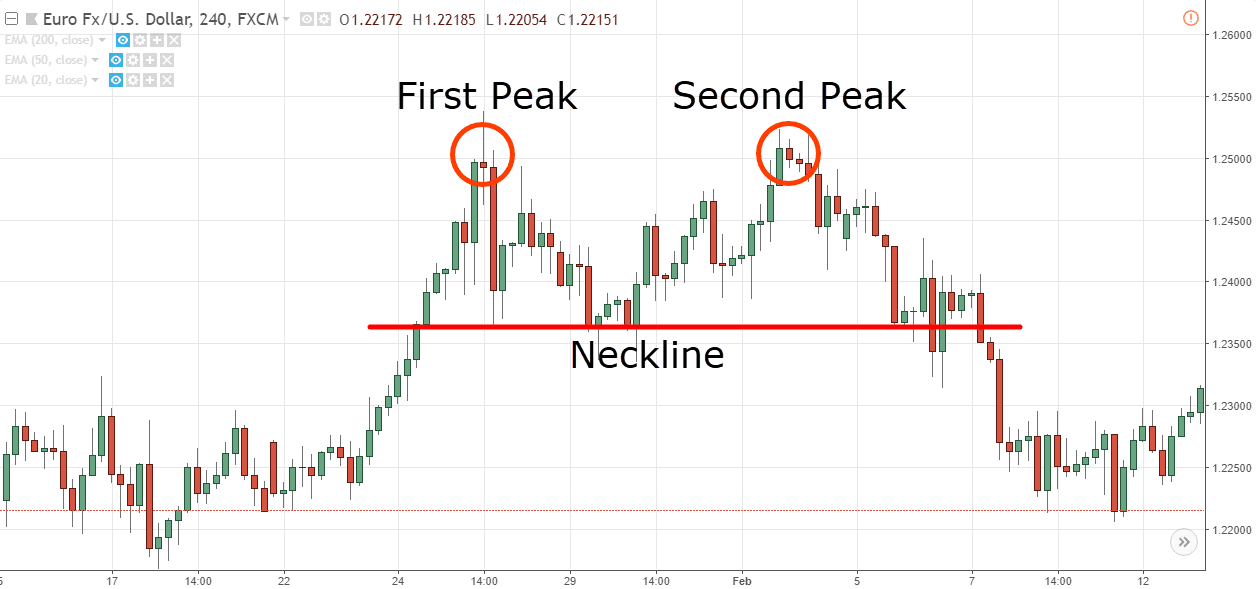
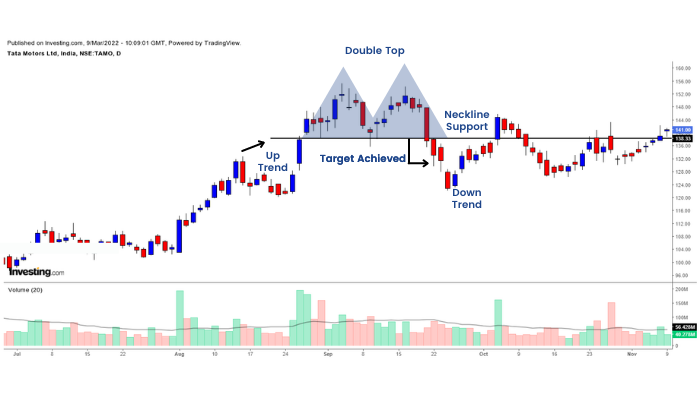
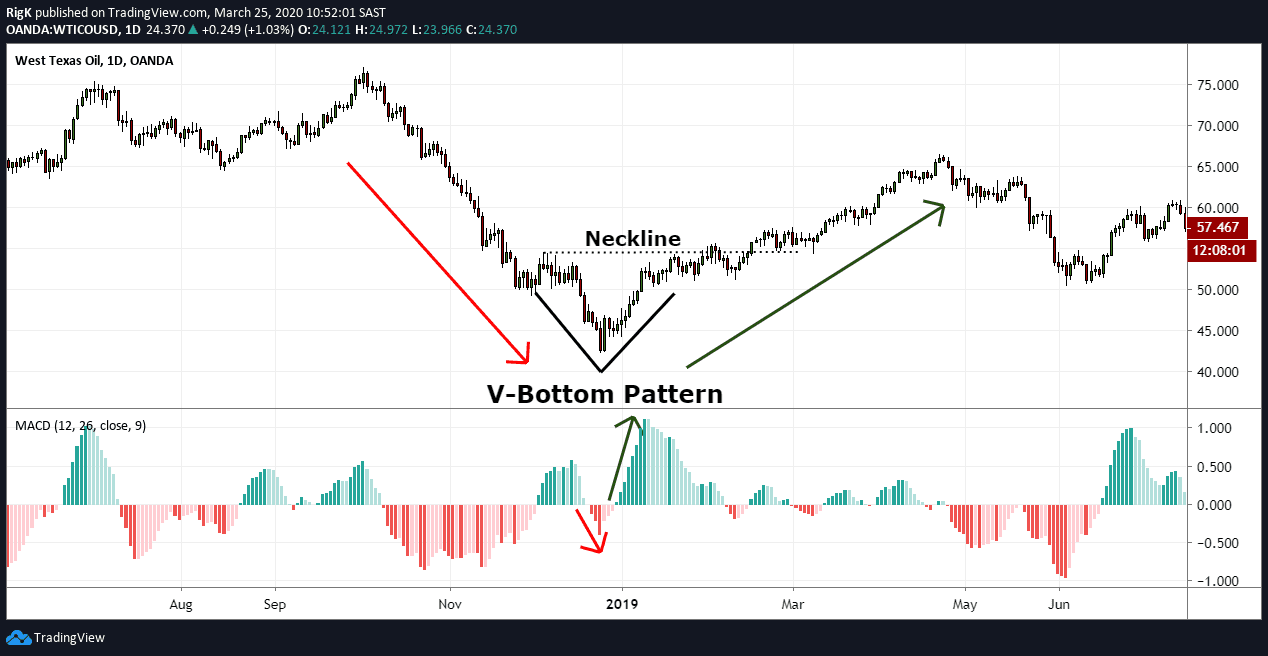
Double Top / Double Bottom
Двойные вершины/дно часто образуются из‑за набора позиций и последующего сброса ликвидности. Следите за реакцией цены на уровнях.
If you’ve been around for at least a couple of weeks, you might have heard of the Double Top/Double Bottom pattern. Let’s start with the absolute basics — the ABC of what this pattern is.
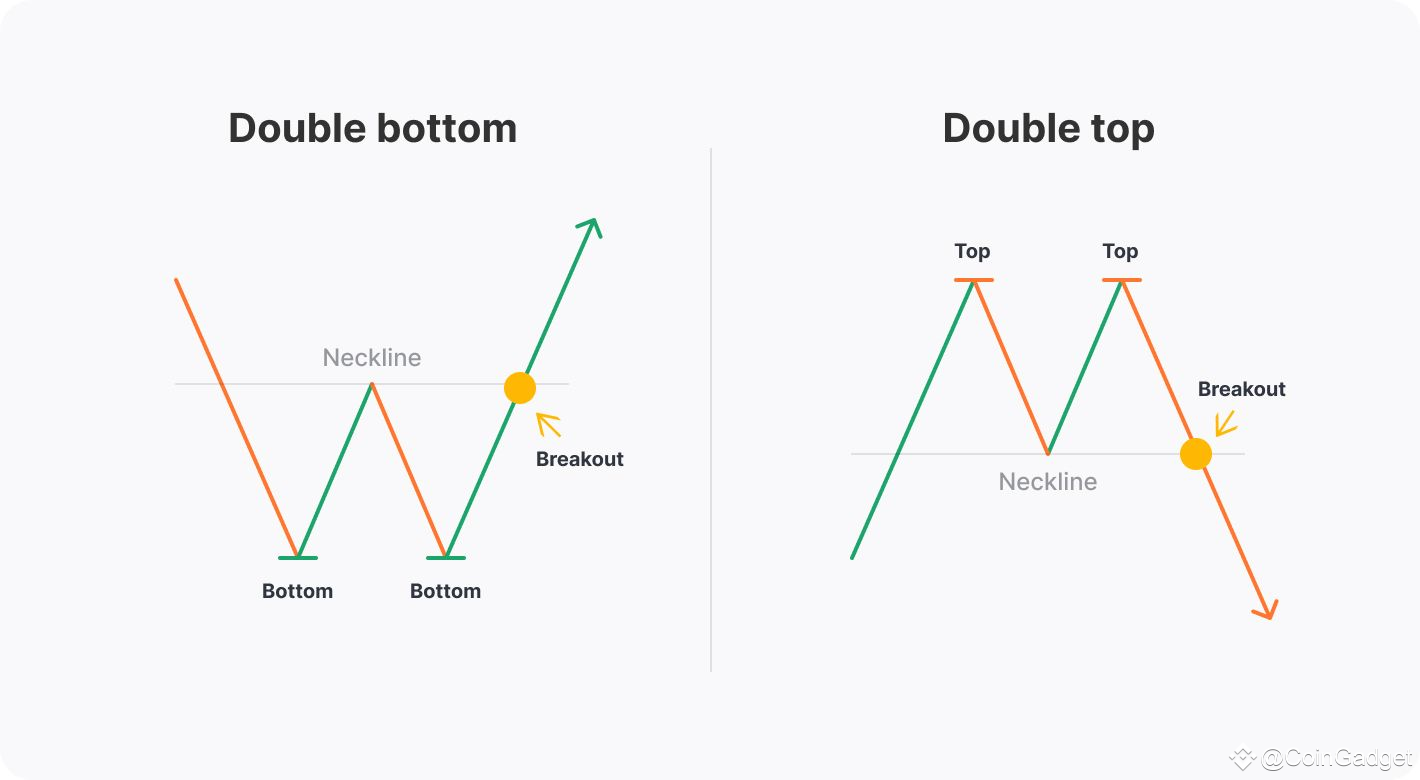
A double top forms after an uptrend. Price reaches a peak — that’s the first top — then pulls back, then rallies again to roughly the same level to form a second top, but fails to break higher. After that second failure, price drops below the low that was made between the two tops, a level often called the neckline or simply the intermediate low. Once that low is breached, the pattern is considered confirmed. A double bottom is the mirror image of that: a downtrend, two failed attempts to push lower, and a subsequent break above the intermediate high.
In classical technical analysis, this pattern is taught as a reversal signal. The logic is that buyers have tried twice to push through a resistance zone and failed both times, so their resolve is exhausted, and sellers take over. It’s straightforward, and for a swing trader looking at daily charts, that might be enough. But we’re not swing traders. We’re scalpers sitting in front of a DOM terminal, watching the tape in real time. And for us, the classical description leaves out almost everything that matters. It tells us what happens, but not how it happens — and the “how” is where our edge lives.
Now, let’s connect this to the broader idea we established earlier: a reversal is a shift in control from aggressive buyers to aggressive sellers, or vice versa. A double top, in its classical form, is simply the result of that shift. But if we wait until the neckline breaks, we’re entering after the shift has already been fully expressed in price. In scalping terms, that’s too late. What we want to do is watch the process of the second test — because that’s where control actually changes hands. And that process reveals itself not in the shape of the chart, but in the order book, the volume profile, and the behavior of large‑size orders.
So let’s walk through what we’re looking for when we compare the first test and the second test. During the first test, we’re looking for signs of genuine initiative: clean consumption of liquidity, a tape that’s moving with conviction, and the absence of strong passive opposition. That’s the baseline — what a healthy, trend‑driven push looks like.
When price returns for the second test, we’re watching for divergence from that baseline. The principles we care about are:
- Volume‑price relationship. If volume expands but price stalls, that’s a red flag. Healthy moves show price expansion on volume; stalls on volume suggest absorption.
- DOM structure at the level. We look to see whether large limit orders appear and hold — especially on the side that was previously being consumed. Persistent passive size that wasn’t there the first time is also a tell.
- Absorption in the tape. Aggressive prints that don’t move price, combined with the order book refreshing rather than thinning, indicate that the initiative is being neutralized.
- Liquidity underneath (or above). We pay attention to whether support behind the move remains intact or quietly disappears. Pulled bids (or pulled offers) signal that the path of least resistance is about to open up.
What you should avoid is treating the double top as a fixed entry template. Don’t short it just because price made a second high. And don’t ignore what the order book is telling you in real time. And certainly don’t rely on the shape alone without confirming whether the flow matches the reversal narrative. A clean‑looking double top with no absorption, no passive opposition, and no liquidity shifts is often just a pause — or worse, a trap.

Head and Shoulders
Голова и плечи — разворотный сигнал, где важны ключевой уровень пробоя и подтверждение объёма.
Now let’s turn to another classic reversal: the head and shoulders. You’ve probably seen this one drawn up with trendlines and neckline measurements — it’s a staple in technical analysis. But we’re going to strip it down to what matters for an intraday scalper.
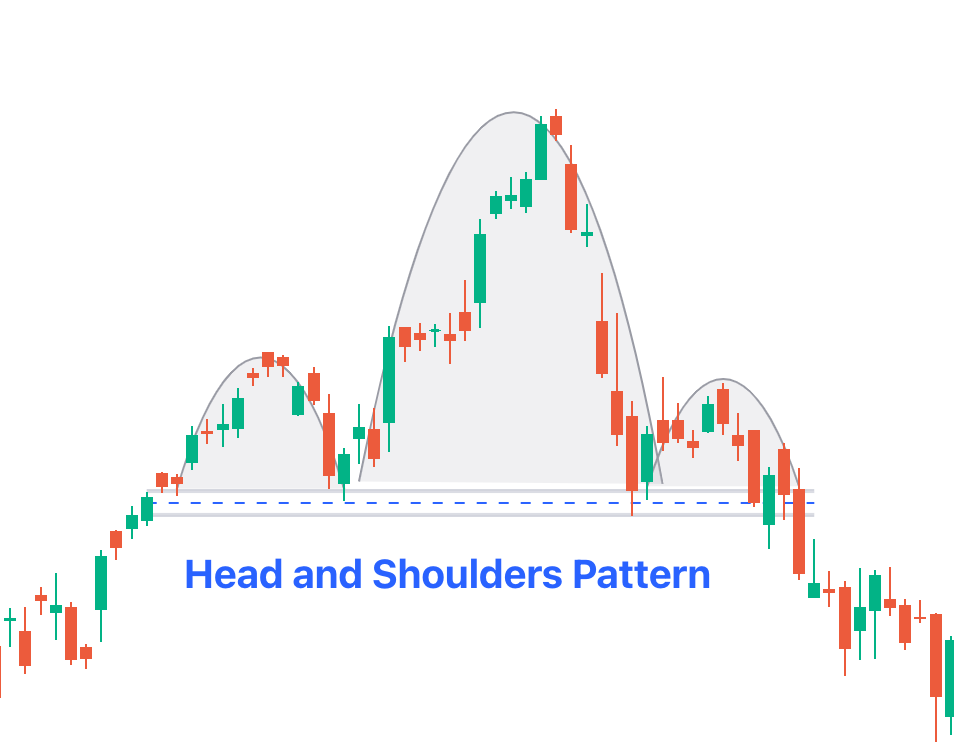
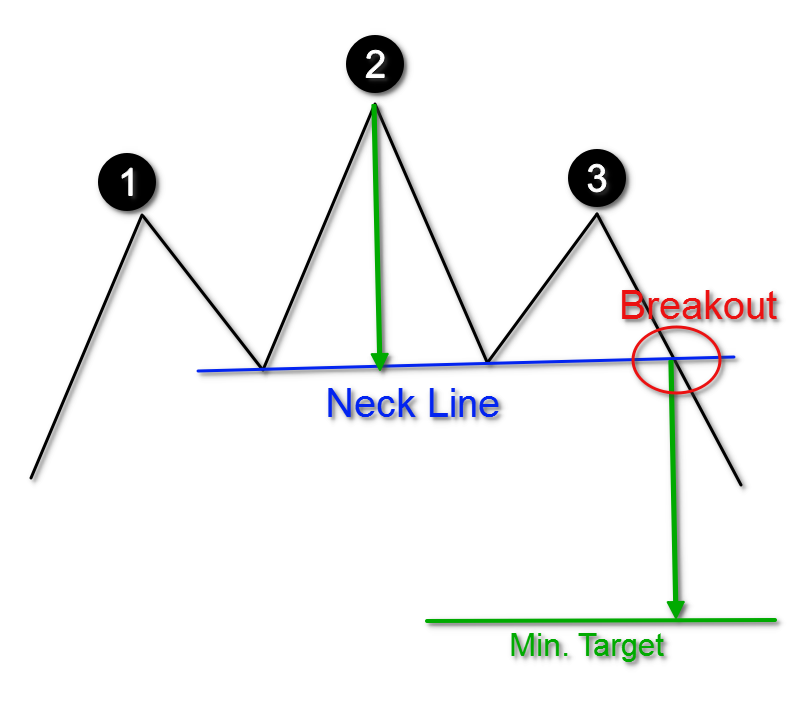
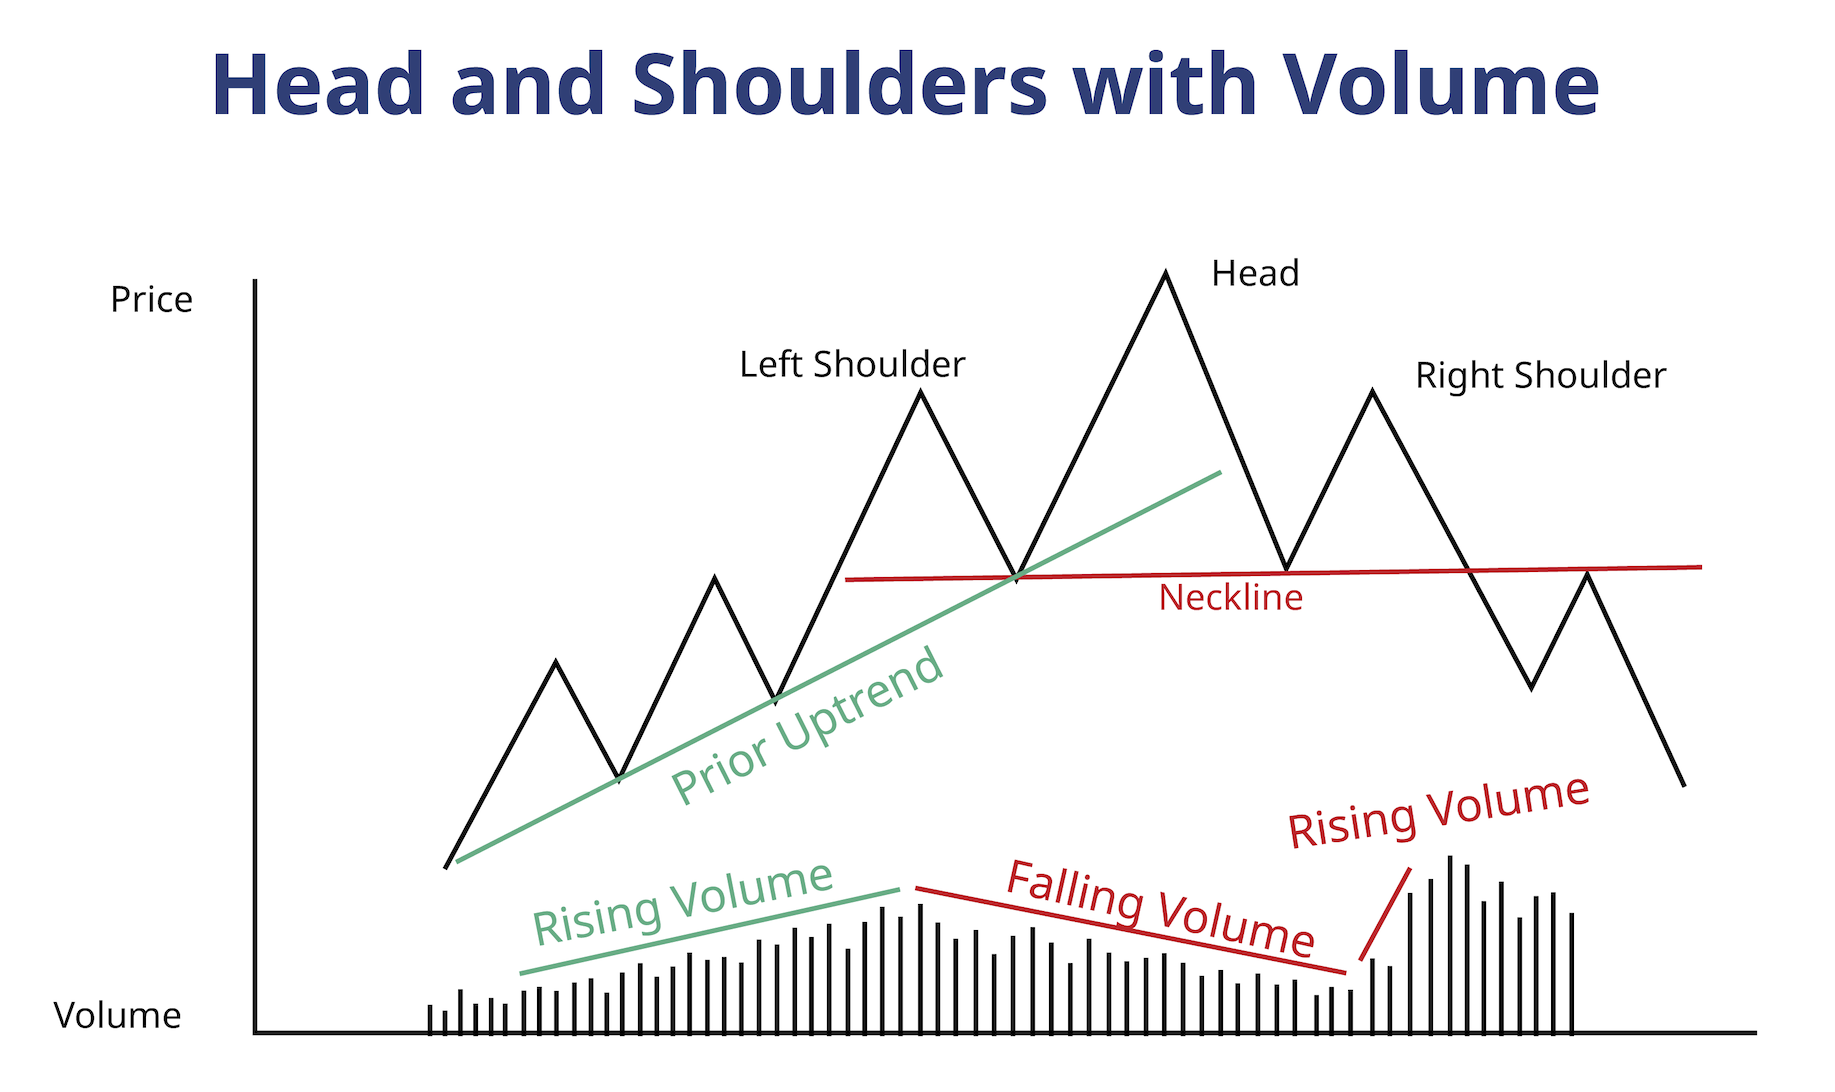
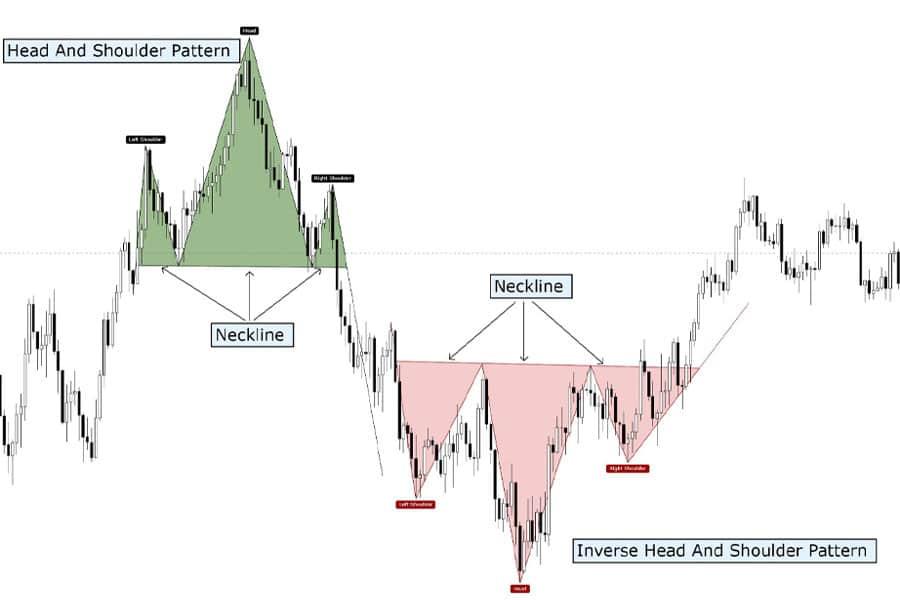
At its core, a head and shoulders is just a three‑part structure. You’ve got a left shoulder, then a higher push to the head, then a weaker rally to the right shoulder, followed by a break below the neckline — that’s the support level connecting the lows of the pullbacks between each peak. The classic interpretation is exhaustion after a prolonged trend, with the neckline break confirming the reversal. That’s fine as a description, but let’s reframe it in terms of order flow.
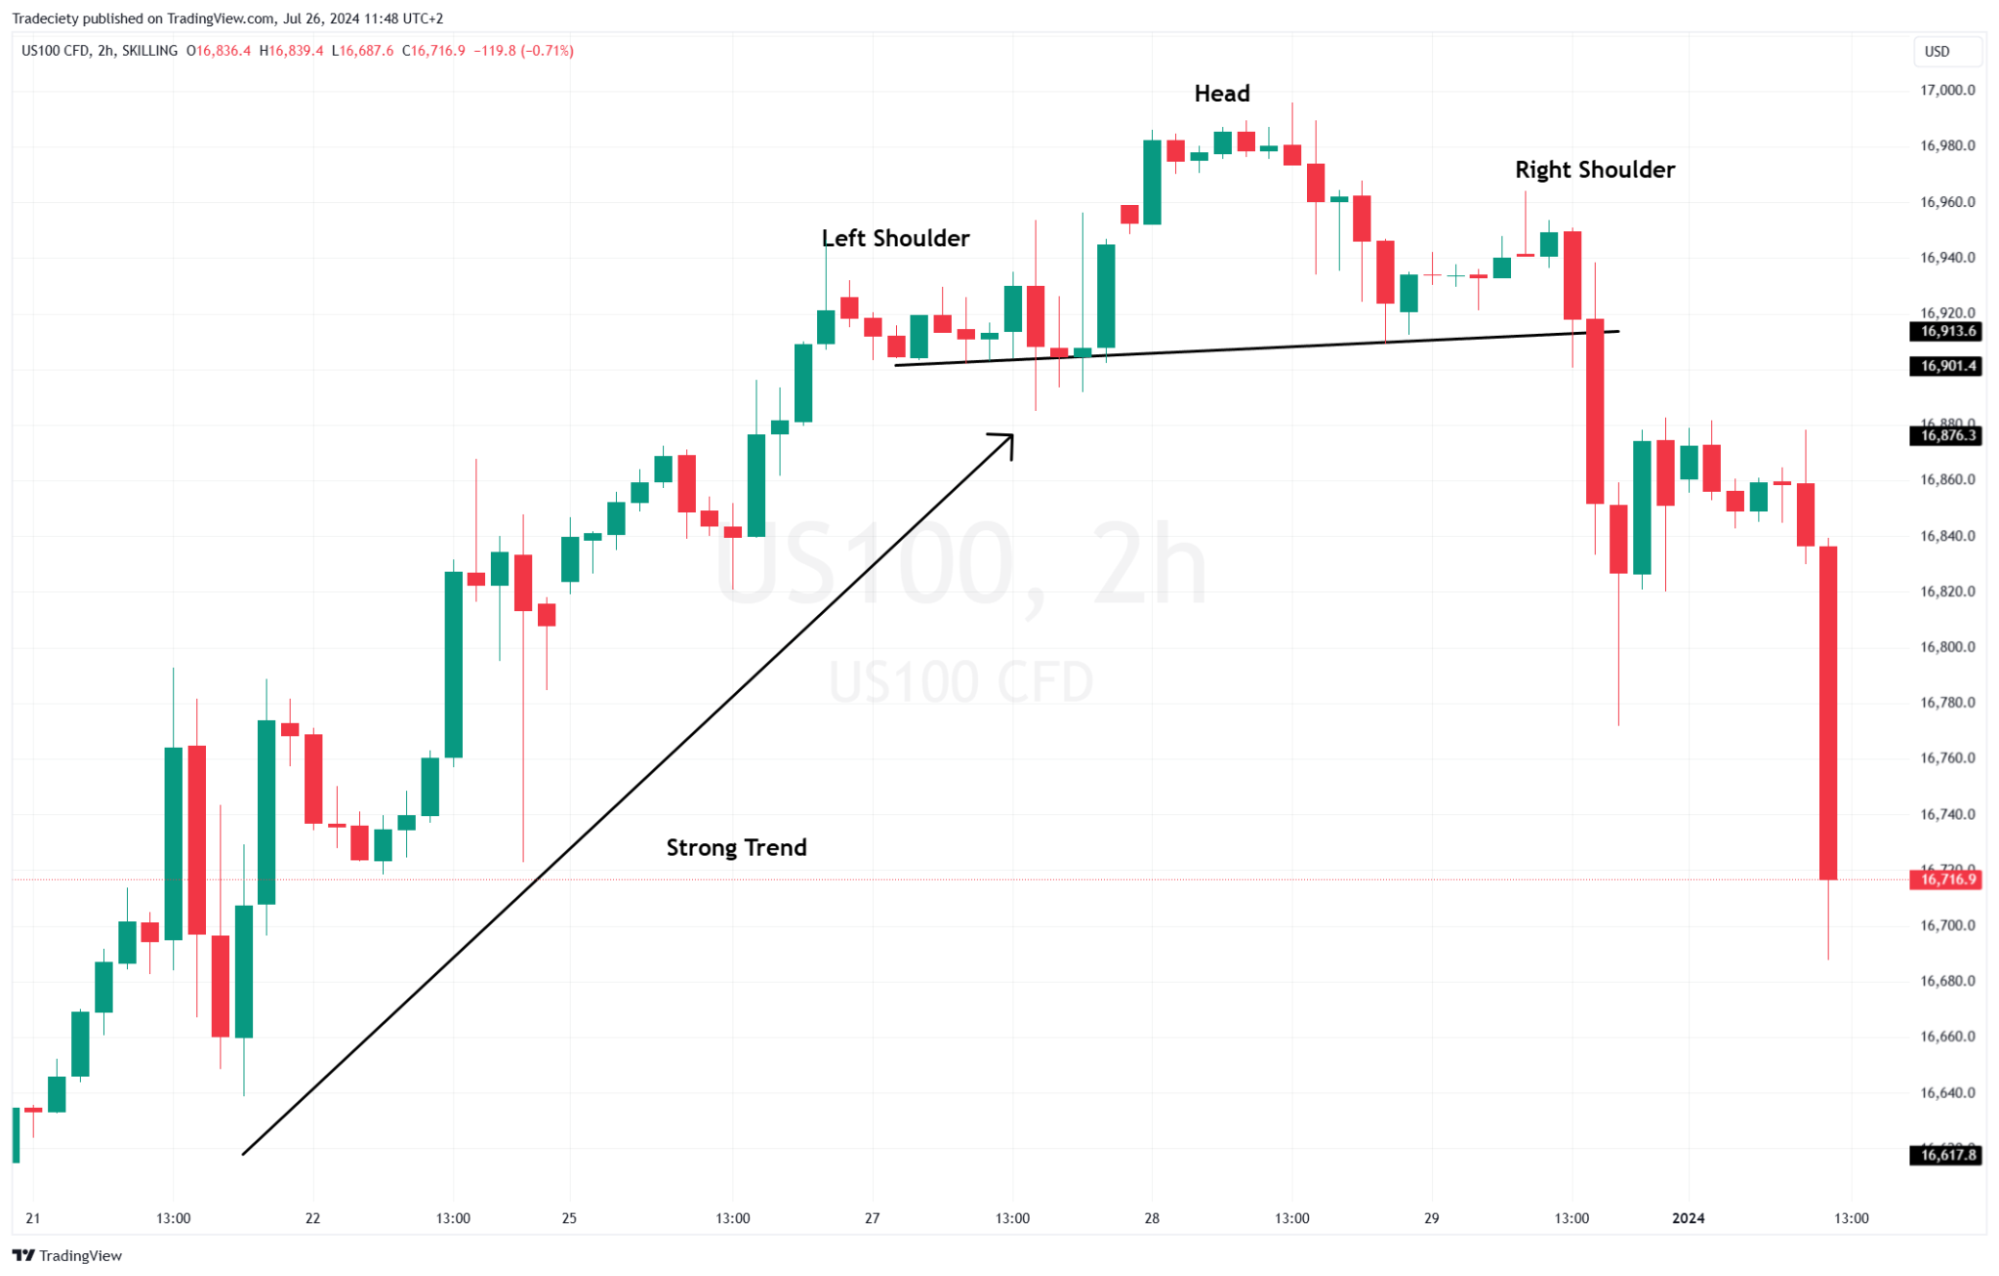
Think of it as a failed continuation attempt followed by lower acceptance. The market tries to keep the trend going, fails, and then struggles to hold at levels where buyers used to show up. The whole story is told by how the aggressive side weakens across those three peaks. Let’s walk through those.
During the left shoulder, we’re still in a clear uptrend. Aggressive buyers are in control. The push up is clean — we see market orders lifting offers, liquidity getting consumed, and the DOM above is looking relatively thin. The pullback that follows is normal; it’s just profit‑taking or a pause after a leg up. At this stage, nothing suggests a reversal.
Then comes the head. Price pushes higher, often on volume that’s even stronger than the left shoulder. To a casual observer, this might looks like continuation. And in a sense, it is — buyers are still spending. But here’s where we start paying closer attention. Even though we got a higher high, we might notice cracks. Follow‑through after the initial push may be limited; instead of accelerating, price stalls near the peak. The pullback from the head often gets sharper, and the volume during that pullback may show selling pressure. So what we’re seeing is that buyers managed to push to a new extreme, but they’re having a harder time holding those levels. The aggressive side is still present, but their grip is clearly starting to slip.
Now we get to the right shoulder, and this is where the story becomes clear. The right shoulder is all about weakening. Instead of the same conviction, we start noticing slower tape, lighter volume, and passive sellers stepping in earlier. Where the left shoulder and head had offers getting lifted cleanly, the right shoulder often shows stacking on the offer side — large limit orders that appear and just sit there, not getting eaten. That’s the transition. If buyers were still in control, the right shoulder should at least challenge the head. When it falls short, control is shifting.
During the right shoulder, we’re watching for deterioration in the order book. Each successive push higher should have less force behind it — offers that refresh instead of thinning, tape prints that show absorption rather than clean consumption. Pay attention to pullbacks too: if they become easier — say, fewer bids are supporting the downside — that tells you the passive side is losing interest. And watch whether sellers who were passive earlier start becoming active, like moving their limit orders lower to get filled. Once you see that passive defense gives way to active aggression, that’s a key confirmation that control is no longer with the aggressive side.
The actual reversal often crystallizes at the neckline. For us, that’s the point where the structural shift we’ve been watching finally shows up in price. What we want to see is a breakdown not just in price, but in liquidity: bids below the neckline getting pulled, market sells accelerating with a volume spike, and little to no absorption below. When those elements align, the imbalance flips. The order flow tells us that the buyers who were present during the left shoulder and head have either stepped aside or become sellers, and the market is now trading into a liquidity vacuum.
For the inverse head and shoulders, everything mirrors. You’re looking for weakening sellers across the three troughs, early buyer presence, and a break above the neckline into a liquidity vacuum on the offer side.
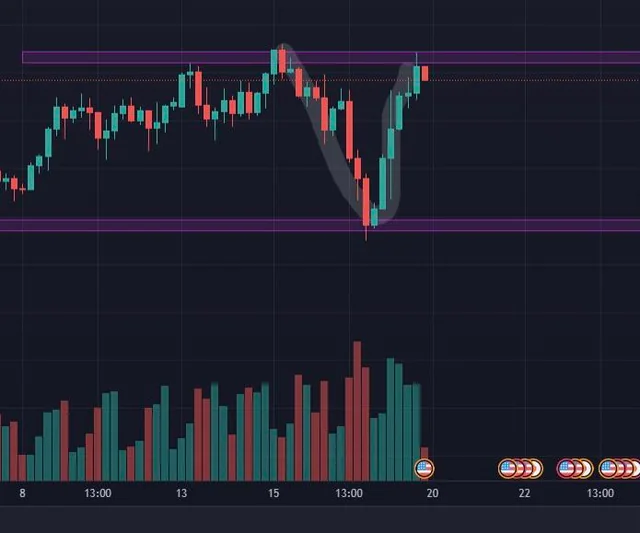
V-Reversal aka Exhaustion Spike
V-Reversal (истощение импульса) обычно выглядит как резкий разворот после сжатия движения. Не входите без подтверждения.
We’ve looked at patterns that take their time — the double top, the head and shoulders — where you can watch the shift in control unfold over several swings. Now let’s turn to something that happens really fast. We’re talking about the exhaustion spike, or V‑reversal.
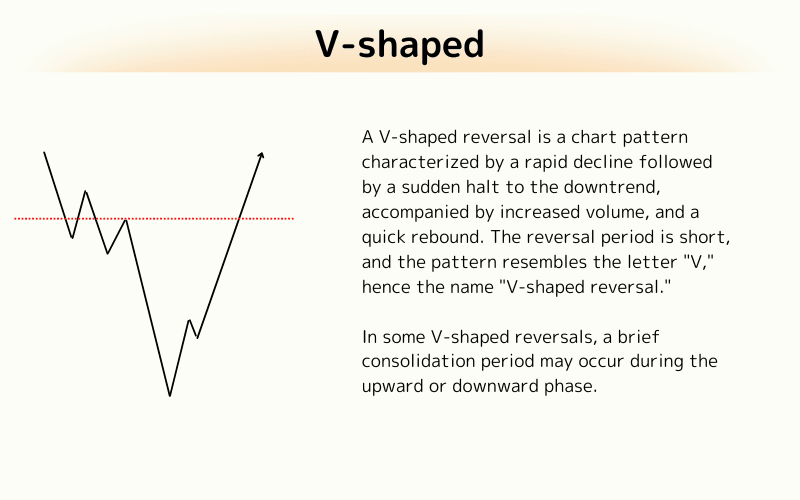
Suppose you’re in a market that’s been relatively calm — maybe trending, maybe just casually chopping around. Then, out of nowhere, price makes a sharp vertical move, up or down, often on very high volume and with a tape that’s screaming. It feels like a breakout. Momentum traders are hitting their hotkeys, algos are piling in, and it seems like price is about to run away. And then, suddenly, it doesn’t. The move stalls, and within moments, price reverses and snaps back, often retracing the whole spike or more.
Because this doesn’t look like a neat textbook pattern, a lot of traders dismiss it as random noise. But from an order flow perspective, it’s actually one of the more predictable structures we can trade — if you know what to look for.
Let’s think about what’s happening under the hood. When that vertical move starts, it’s usually driven by late participants piling in aggressively. Maybe a news headline dropped, maybe a cluster of stops got triggered, or it’s just momentum attracting a crowd. Market orders flood the book — buyers lifting offers in an up spike, sellers hitting bids in a down spike. Price extends quickly because the liquidity on the side of the move is getting consumed faster than it can replenish.
But here’s the key. Often, while the crowd is chasing, larger players are quietly doing the opposite — they’re offloading into that aggression. If we’re spiking up, they’re hitting the bid with size — not trying to reverse the move, but getting filled against the flood of market buys. If we’re spiking down, they’re lifting the offer. They’re absorbing the aggressive flow. And because they have size, they can do this without immediately stopping the price. The spike continues, but now the buying (or selling) is meeting passive opposition that wasn’t there a moment earlier.
So what are we watching for here? At the extreme, we’re looking for absorption, where volume stays heavy — often climactic — but price stops advancing. The tape might still show green print after green print in an up spike, but each print moves price less and less. That’s a signal: the aggressive side is spending, but getting nowhere.
On the DOM, we’re looking for large opposing orders appearing at the extreme. In an up spike, that means large passive bids showing up where they weren’t before, sitting there, not getting lifted. In a down spike, it’s large passive offers on the ask. That’s often the footprint of larger players stepping in to absorb.
The turning point happens when the aggressive flow dries up. The late participants have all entered; the market orders become intermittent. At that moment, the larger players who were absorbing often flip and become initiators in the opposite direction. They start hitting the bid in an up spike, or lifting the offer in a down spike.
But there’s another piece we need to watch: liquidity behind the move. In an up spike, the bids that were stacked a few ticks below the peak start getting pulled. The support underneath disappears. So when that first market sell finally hits, there’s nothing underneath to catch it. In a down spike, it’s the offers behind the move getting pulled, creating a vacuum to the upside.
Overall, try to avoid treating every spike as a reversal. Without absorption — that is, large opposing orders appearing and volume stalling — a spike can just be the start of a genuine trend. So don’t rush into trying pick the exact top or bottom, that’s chasing price. The edge is in recognizing the failure of the move, not in catching the first tick. And we never trade a V‑reversal in isolation from the volume. The shape alone is meaningless without the order flow confirmation.
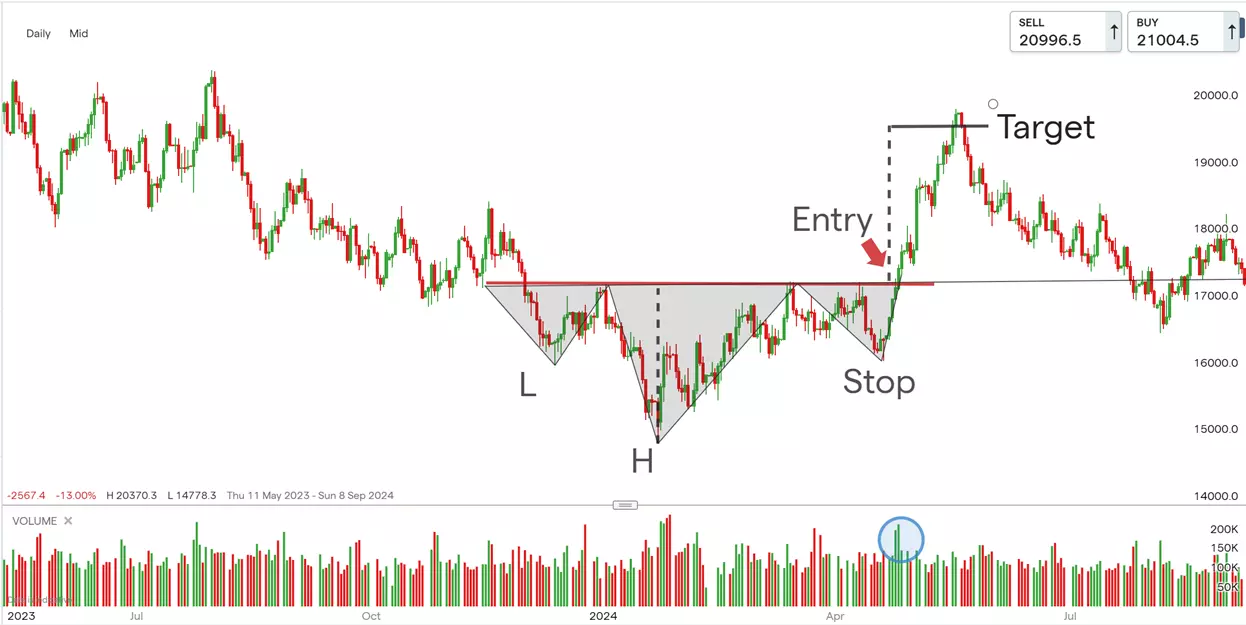
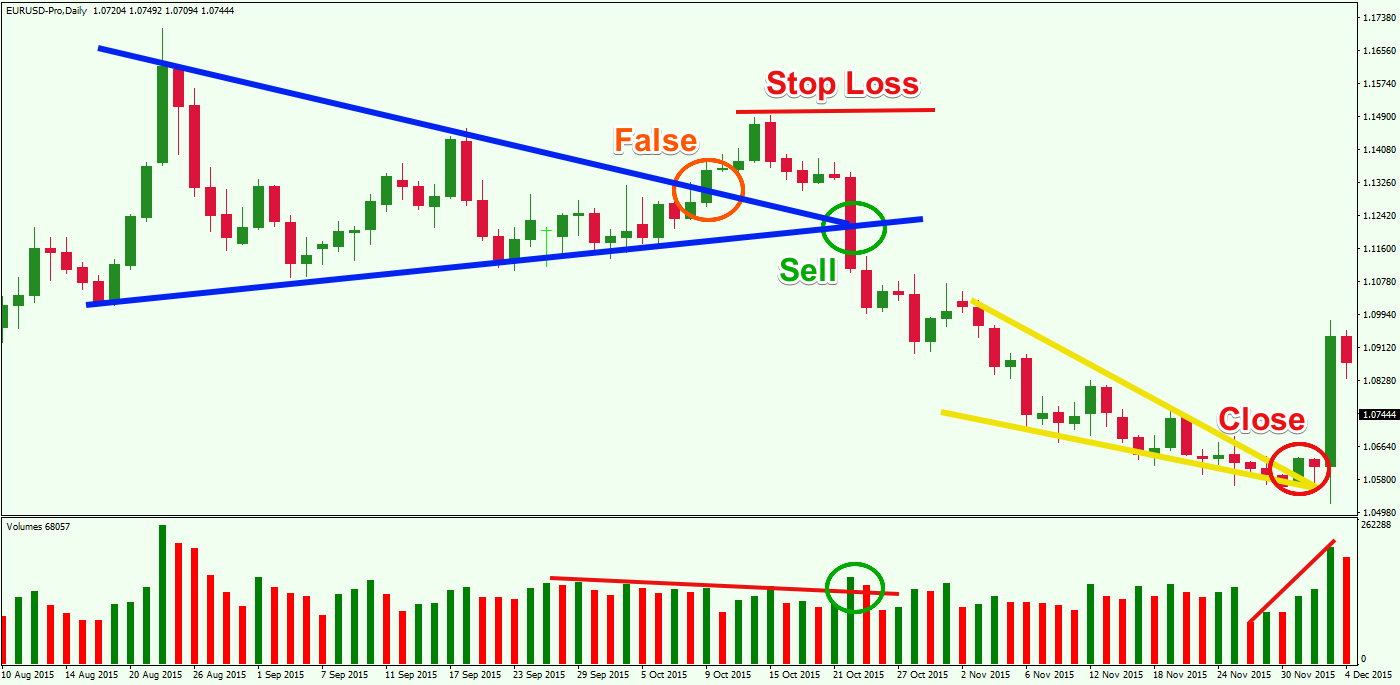
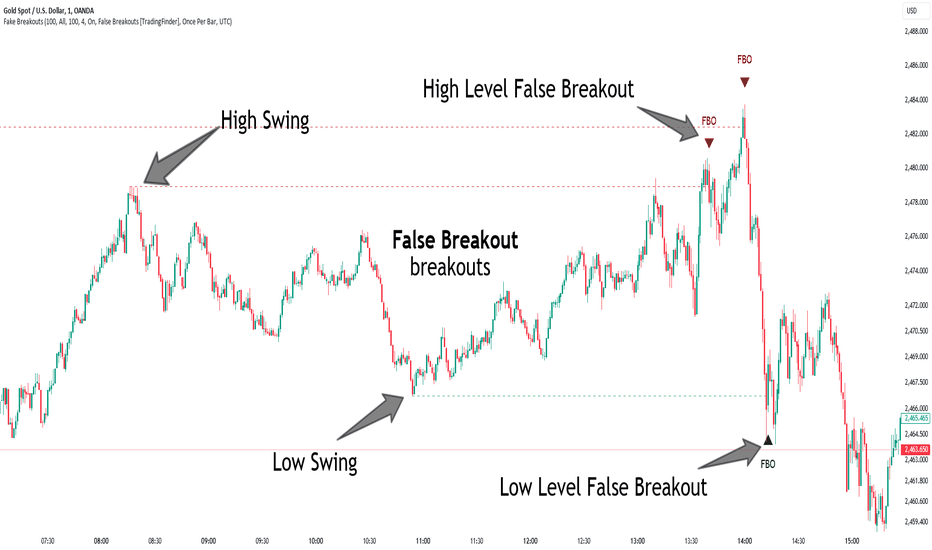
Failed Breakout (Range Reversal)
Неудачный пробой в диапазоне часто возвращает цену обратно внутрь структуры. Смотрите, как меняется спрос и предложение.
We’ve looked at the double top, the head and shoulders, the V‑reversal — all of them sure have their own rhythm. Now let’s talk about something that sits right in the middle, and this is actually where a lot of intraday edge actually lives. We’re talking about the failed breakout. Some people call it a range reversal, a fakeout — whatever name you prefer, the idea is the same.
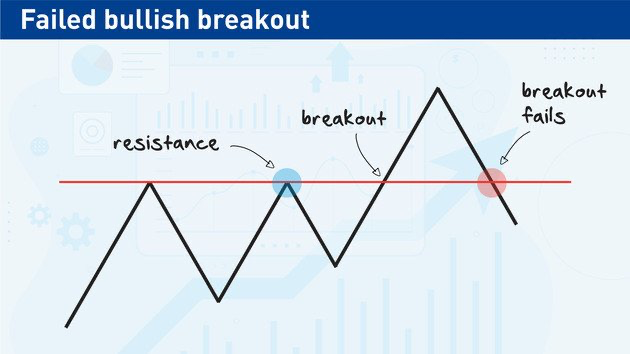
So here’s the deal. Suppose we have a level — maybe it’s a session high, maybe it’s a consolidation range that’s been holding for the last twenty minutes, maybe it’s just a prior swing point that the market keeps respecting. Now, price pushes through that level, and for a moment it looks like we’re off to the races. Then, instead of accelerating, it stalls. And then it rolls over and collapses back inside the range. But our ‘pattern’ to trade isn’t the breakout itself; the pattern is the failure to make that breakout stick.
Now, when you see that failure, and if it comes with the right order flow, it can turn into a sharp move the other way — often bigger than the initial breakout attempt. So what are we actually looking for?

Let’s think it through. During that breakout attempt, ask yourself a few things. Is volume expanding as price goes through? In a genuine breakout, you’d expect to see aggressive market orders consuming liquidity on the side of the move. Are the offers — if we’re breaking up — actually getting lifted, or does it feel like the move is happening on thin, sporadic volume? And what’s the DOM doing? Is it thinning in the direction of the breakout, meaning offers are getting eaten faster than they can replenish? Or do I see immediate stacking against the move — large limit orders appearing on the opposite side the moment we clear the level?
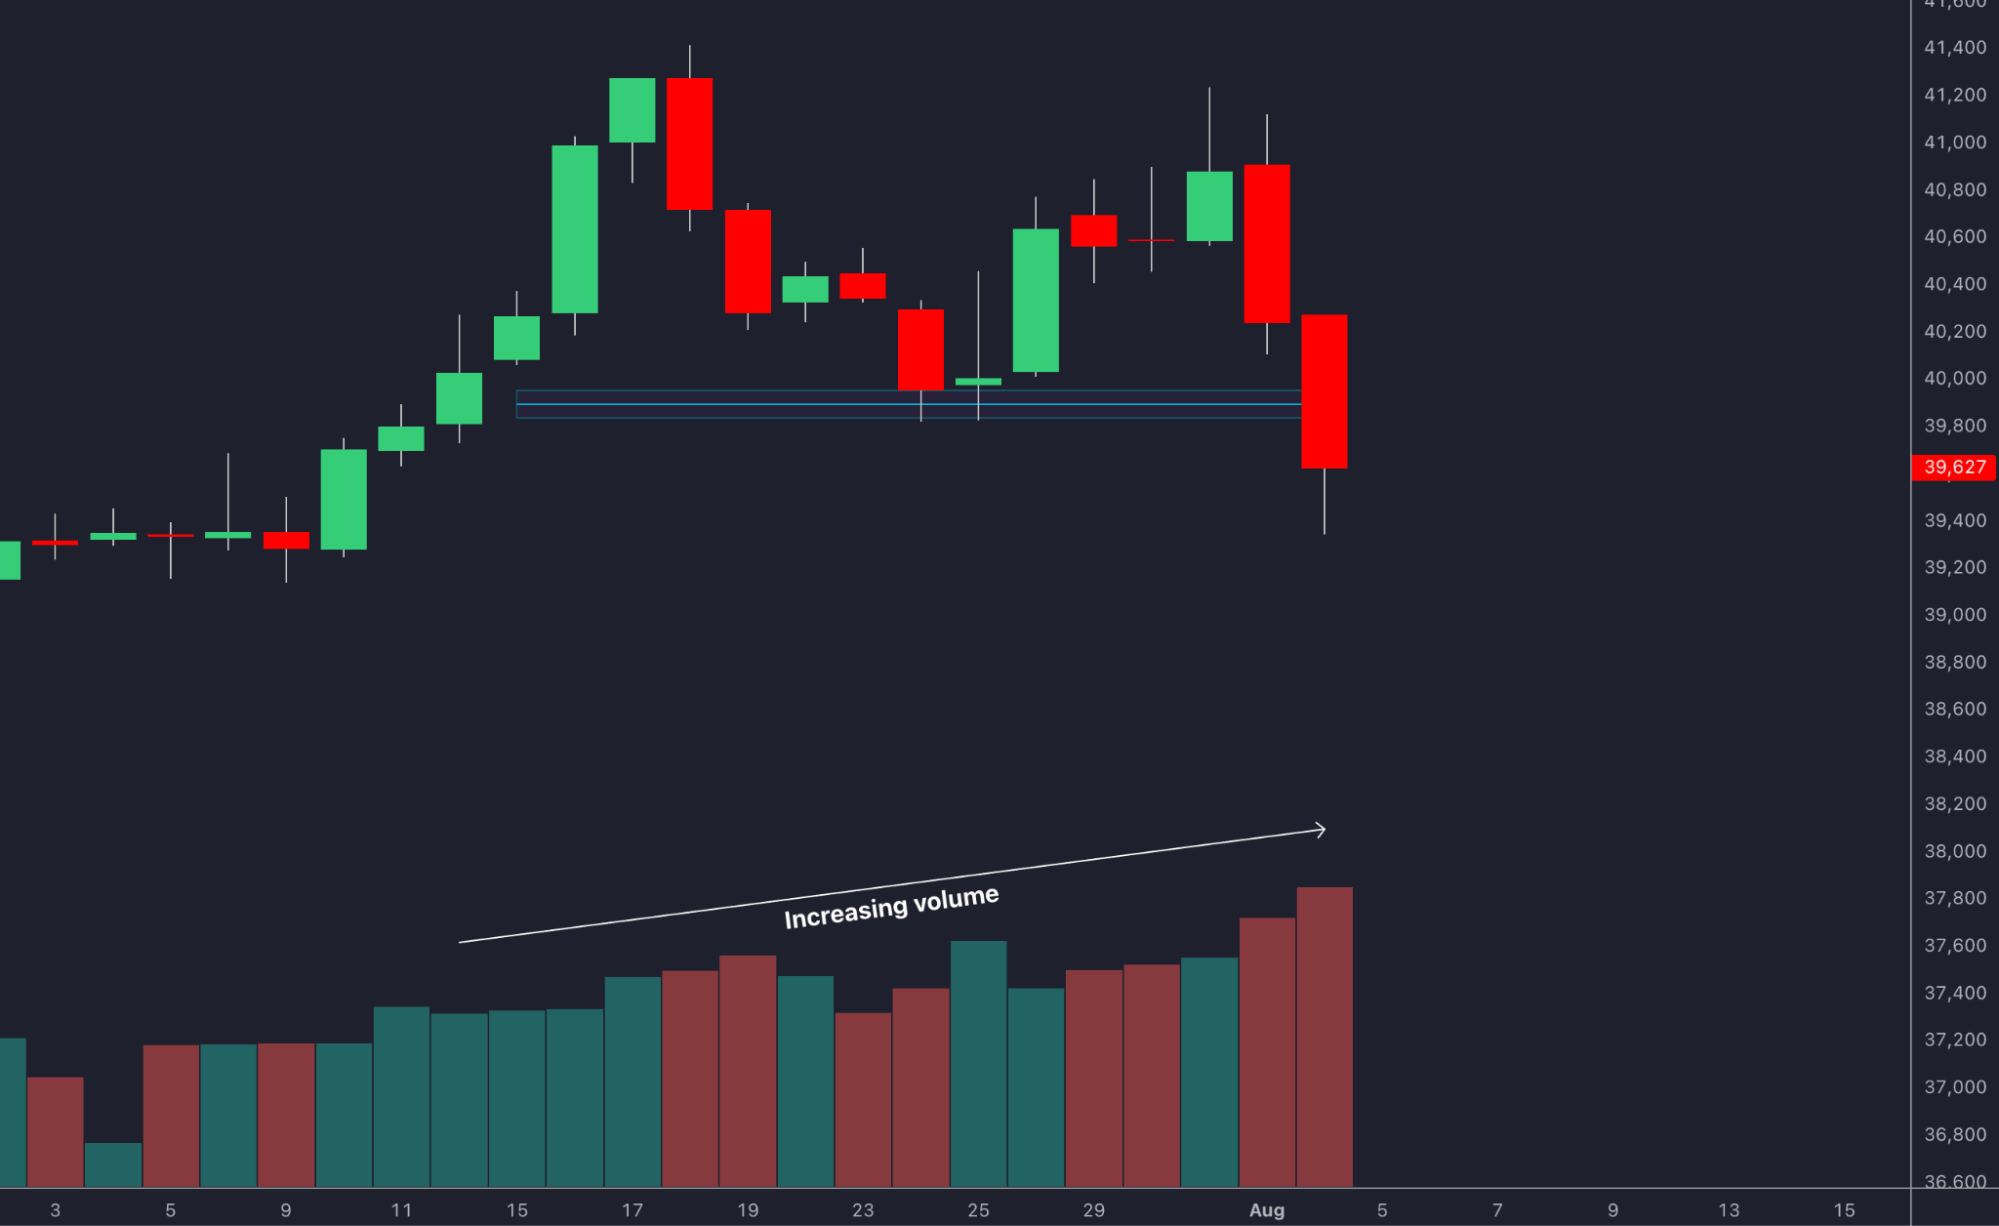
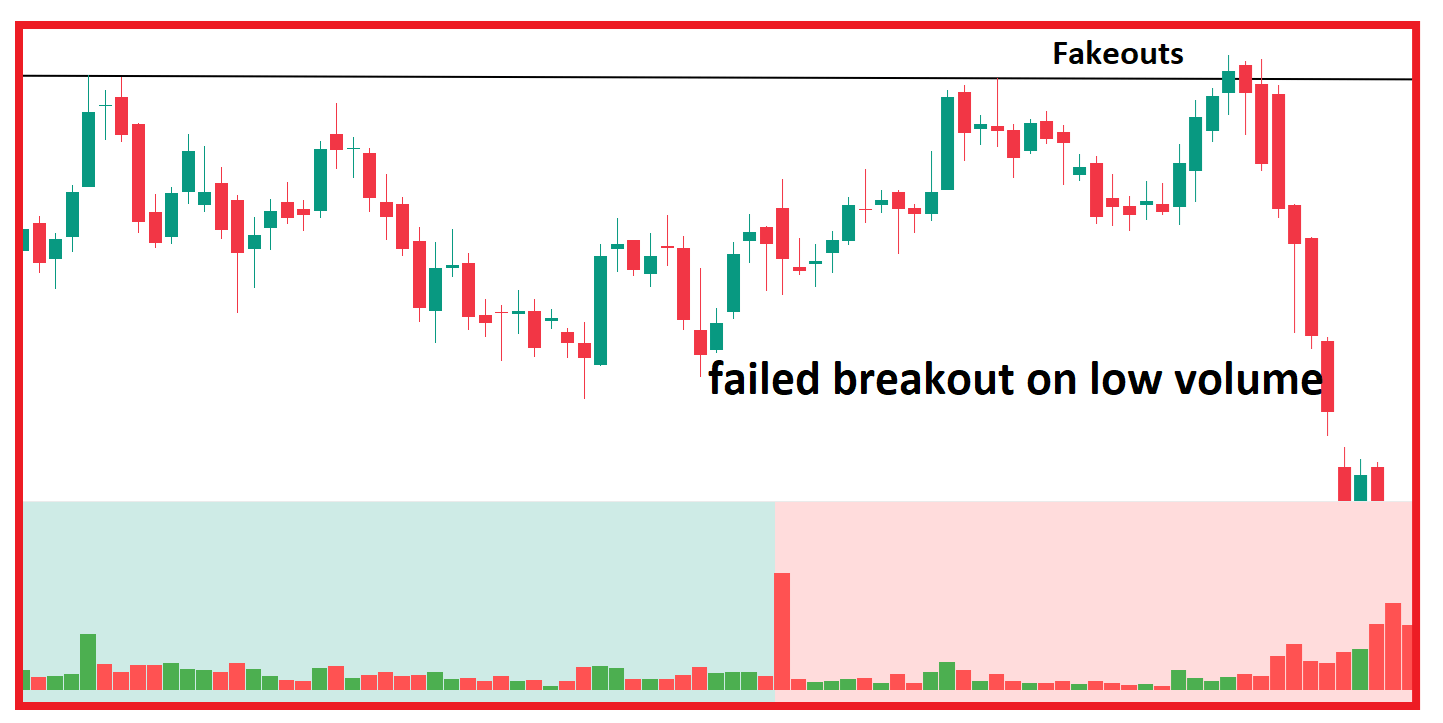
The warning signs are usually pretty obvious once you’ve trained your eye. Breakout on low volume, or volume that’s choppy. Large opposing liquidity showing up right at the level, as if someone is waiting to catch the breakout traders. And most importantly, lack of follow‑through. Price pokes through and just sits there, hovering and never accelerating. That’s often the moment you realize the breakout is being absorbed, not driven.
So what happens next? The traders who bought the break are now, well, trapped. They got in on the visual breach, expecting momentum. Instead, they get a stall. Their stops are usually placed just inside the range — below the breakout point for an upside fakeout, above it for a downside fakeout. When price starts to reverse and reclaim that level, those stops get triggered. And now those stops become fuel in the opposite direction. The same traders who were buying are now forced to sell, adding to the selling pressure. Meanwhile, the larger players who were absorbing the breakout — maybe they were offering size at the level or just above — flip the flow. They step in as aggressive sellers, hitting the bid. As a result, you get that combination of forced exits and fresh aggression, and suddenly the market snaps back into the range.
On the DOM, the tells are usually visible in the seconds after the breakout. You should be watching for immediate stacking against the breakout — large limit orders appearing on the side opposite the move, holding, not getting ‘eaten’. Also watch out for the pulling of liquidity in the breakout direction. Those offers that were above the level, which had been thinning, now start getting cancelled or moved higher. That effectively removes the path for continuation. And then the key moment: price reclaims the breakout level from the opposite side. Once that happens, acceleration often follows because the liquidity that was supporting the breakout is gone. The trapped stops are sitting right there, and the market just sweeps through them.
Now, that’s not to say every failed breakout is a trade. Without clear absorption and that subsequent liquidity shift, a failed breakout can just drift back into the range without any real momentum. Also, avoid entering before the reclaim. Trying to pre‑empt the failure — shorting while price is still above the level — can get you caught if the breakout has one more push left. And never rely on the chart shape alone. A fakeout that looks perfect on paper but has no order flow behind it is nothing more than a fancy shape.
Wrap‑up: How to Treat (and Not Treat) Reversal Patterns
Итог: относитесь к паттернам как к вероятностям, а не к гарантии. Сверяйте сигнал со стаканом и рисками.
Alright, we’ve gone through a handful of reversal structures — double tops, head and shoulders, exhaustion spikes, failed breakouts. If one idea should stick, it’s this: patterns are not signals. What they are is contextual frameworks for reading order flow.
So how do we treat them productively? As early warnings, not triggers. When a pattern starts forming, we let it direct our attention to a specific zone — a level where the order flow might shift. We treat them as locations where imbalance could change, and we use them as a reason to focus harder on DOM behaviour, volume profile, and tape speed. Remember: we’re not trading geometry. We’re trading absorption, aggression, and liquidity shifts. The pattern is just the container that tells us where to look for a setup.
Before we act on any reversal pattern, we ask a handful of real‑time questions: Who is being aggressive here? Is that aggression working, or is it getting absorbed? Who is doing the absorbing? And what happens to liquidity if price moves the other way? If we can answer those, the pattern becomes useful. If not, it’s just a drawing on a chart.