

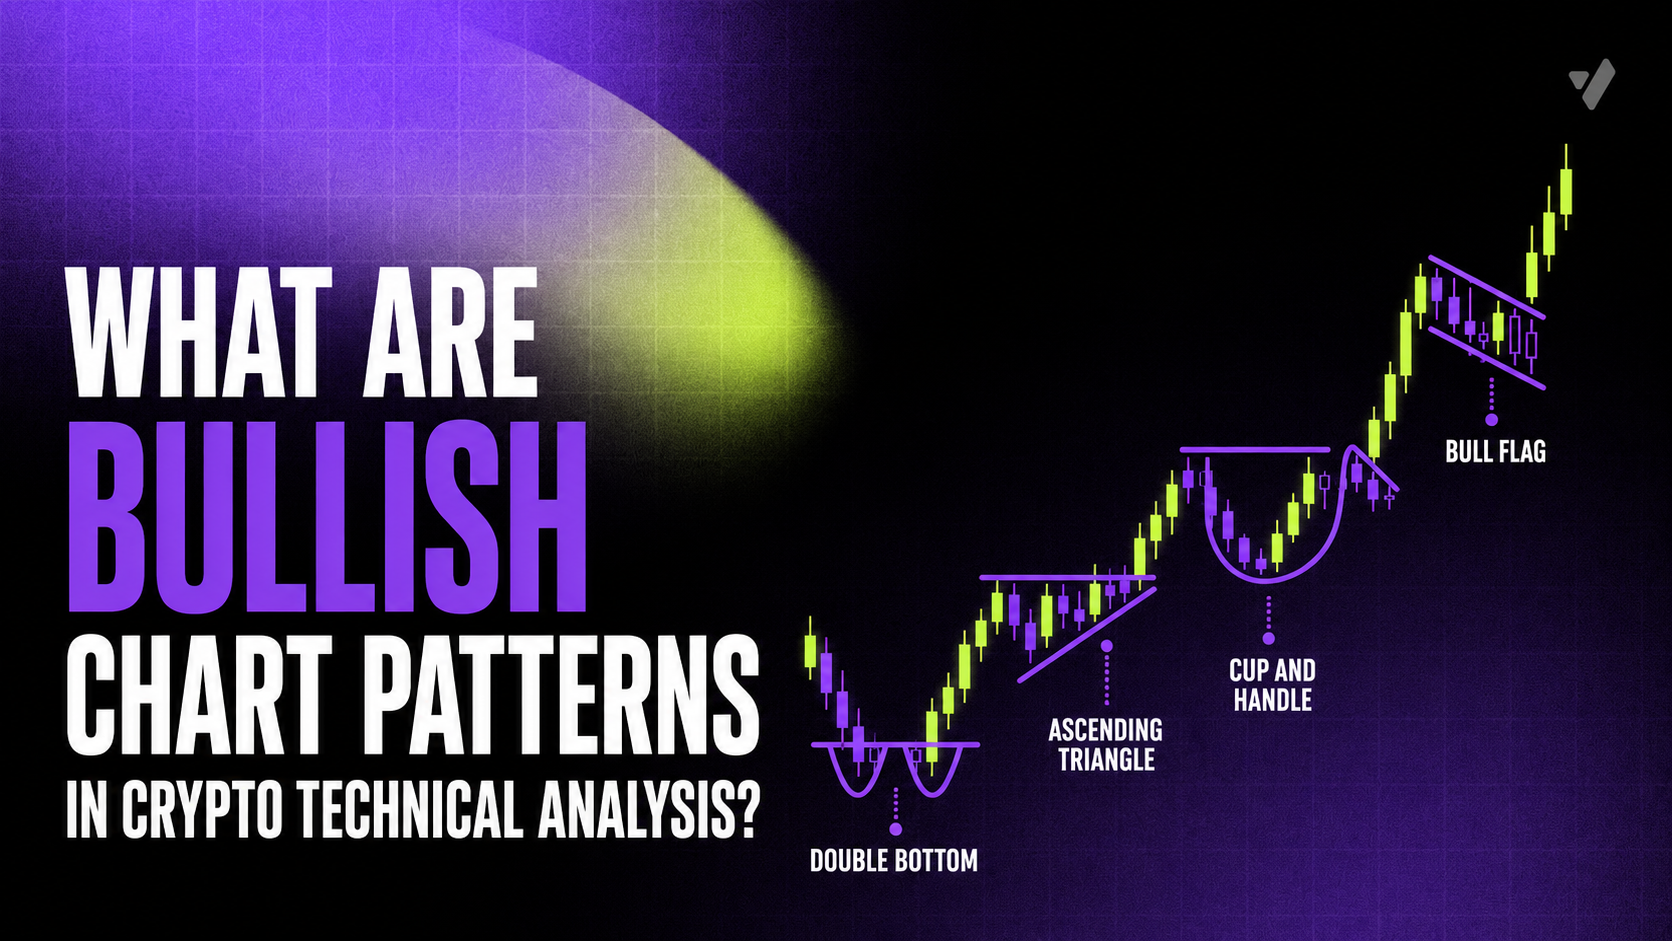

What Are Bullish Chart Patterns in Crypto Technical Analysis?
Bullish chart patterns show where buyers may be gaining control. Reversal patterns, such as the double bottom and inverse head and shoulders, appear after declines. Continuation patterns, such as the bull flag, pennant, ascending triangle, and cup and handle, form during an upward trend. A setup is not complete until price breaks the key level and shows acceptance above it. Volume, liquidity, broader crypto direction, and risk management should confirm the idea. No pattern can guarantee future results.
Table of Contents
What Is a Bullish Chart Pattern?
A bullish chart pattern is a structure formed by highs, lows, and closing prices that suggests a possible upward move. Technical analysis uses repeated market behavior to identify support, resistance, momentum, and changes in buying or selling pressure.
In bullish chart patterns technical analysis, shape is only the first layer. Traders also consider the prior trend, the time frame, volume, liquidity, and what happens after the break. The same pattern can perform differently in calm and volatile market conditions.
For example, an ascending triangle after a strong advance may act as continuation. A similar triangle in the middle of a directionless range may offer little information. Context explains whether buyers are absorbing supply or whether price is simply moving sideways.
A bullish signal does not mean price must rise. It means the upside scenario becomes more likely if the required confirmation appears.
Reversal Versus Continuation
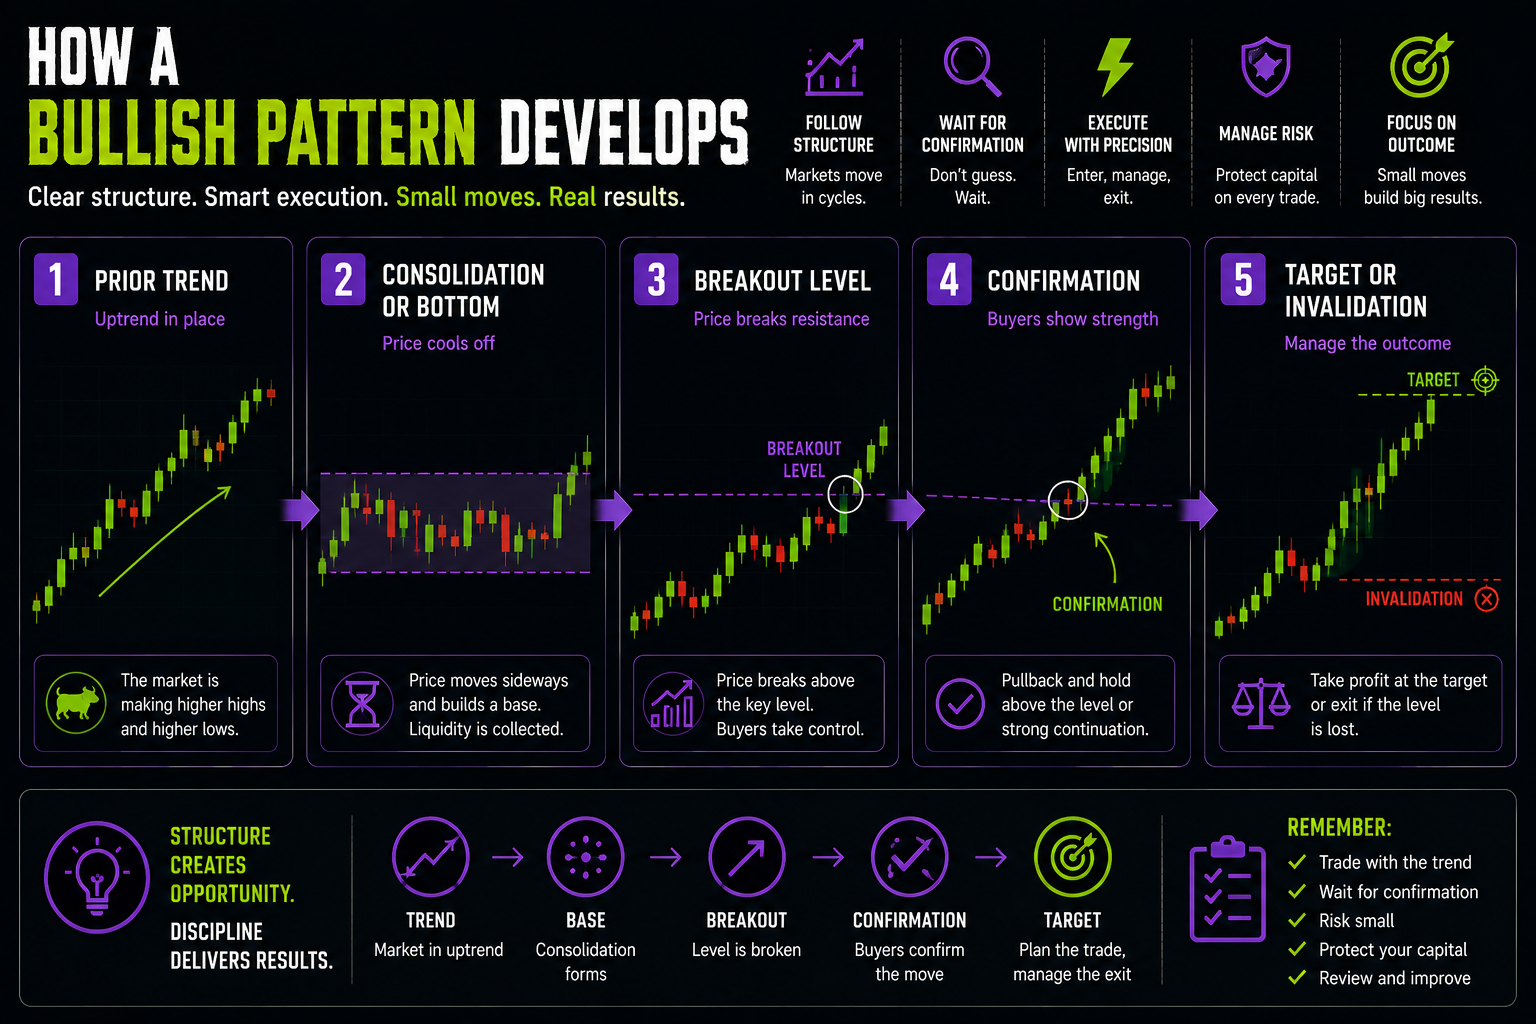
Bullish formations fall into two main types. A reversal structure forms after a decline and suggests that sellers may be losing control. A continuation structure forms during an uptrend and suggests that buyers are pausing before another move higher.
| Type | Typical Location | Market Message | Examples |
|---|---|---|---|
| Bullish reversal | After a downtrend or deep correction. | Selling pressure is weakening. | Double bottom, inverse head and shoulders, falling wedge. |
| Bullish continuation | During an established uptrend. | Buyers may continue after a pause. | Bull flag, pennant, ascending triangle, cup and handle. |
| Context-dependent | Different locations. | Direction depends on the break. | Symmetrical triangle, broad range, wedge variants. |
A practical bullish chart patterns technical analysis trading framework starts with what happened before the formation. Without the earlier trend, a visual outline can be misleading.
Seven Common Bullish Formations
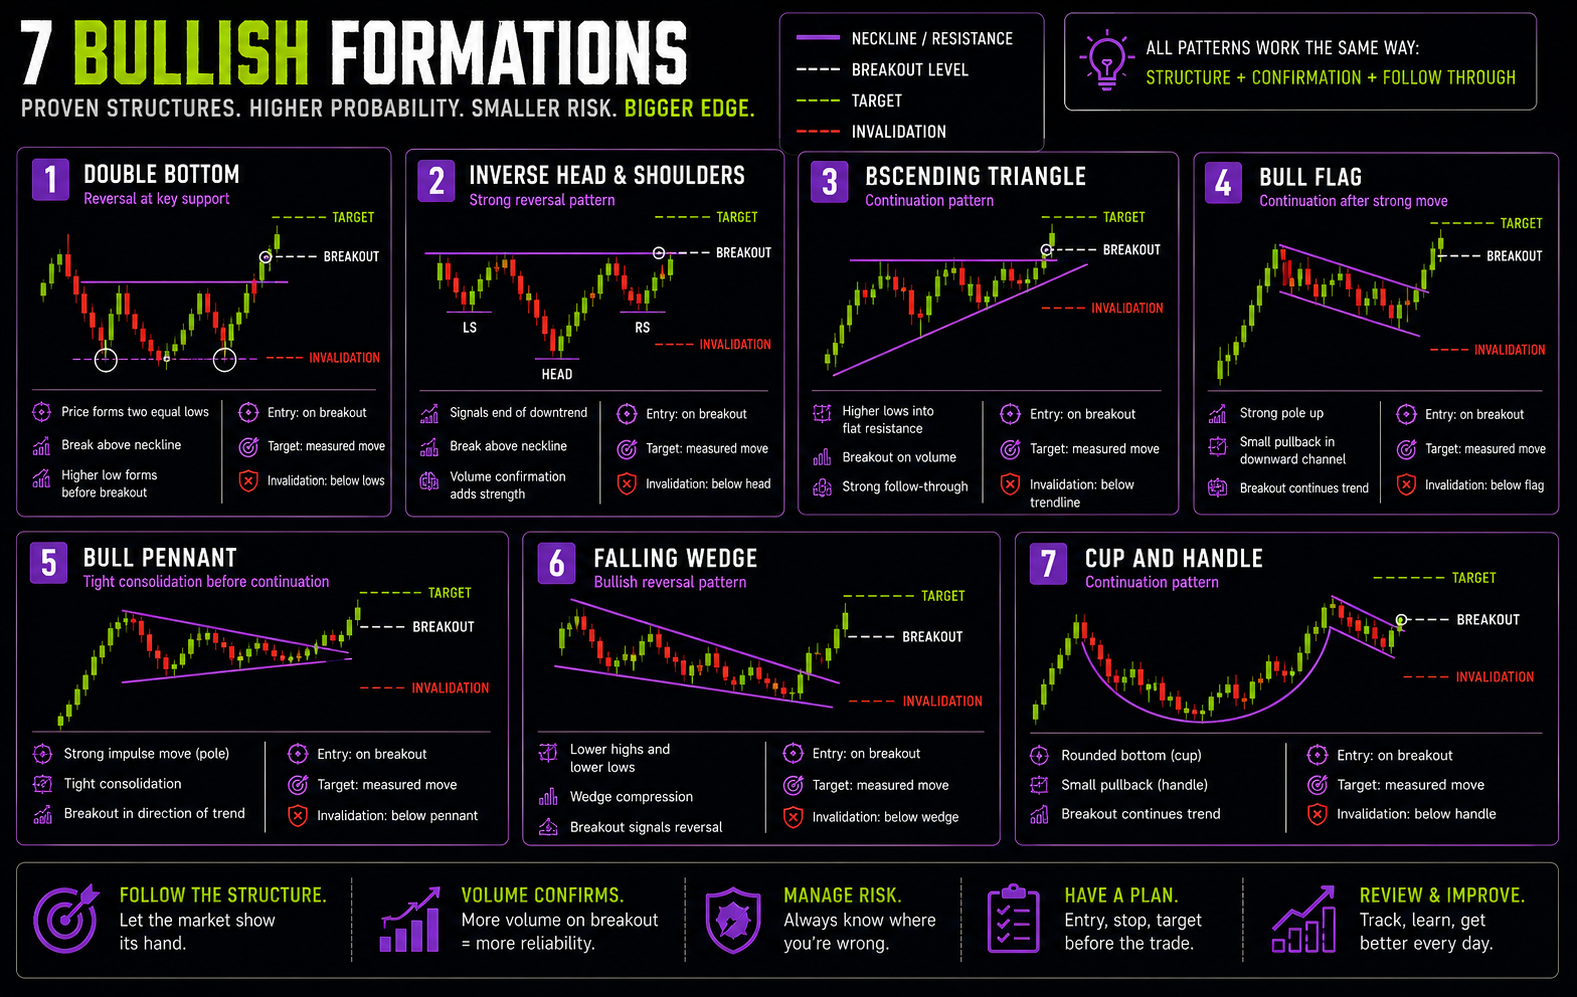
1. Double Bottom
The double bottom looks like the letter W. Price reaches a low, rebounds, returns to a similar support area, and rises again. The peak between the two lows forms the neckline.
The structure suggests that sellers failed twice to sustain lower prices. The second bottom does not need to match the first exactly. A brief move below the earlier low can strengthen the setup if price quickly closes back above support and traps short positions.
Confirmation appears when price breaks and closes above the neckline. Higher volume can show that buyers are participating, but fragmented exchange data should be read carefully. A trader may enter on the break or wait for the neckline to be tested as support.
A stop can sit below the second low or below the retest. A common target projects the distance from the bottom to the neckline above the breakout. Nearby resistance may require an earlier exit.
2. Inverse Head and Shoulders
This reversal pattern contains three troughs. The middle trough, called the head, is the lowest. The left and right shoulders form at higher or similar levels. The line through the reaction highs is the neckline.
The pattern shows a gradual shift in pressure. The second decline makes a lower low, but the market recovers. The third decline is weaker, suggesting that sellers have less momentum.
A break above the neckline completes the pattern. In this form of technical analysis, perfect symmetry is not required. The sequence of failed selling attempts and the response above the neckline are more important than identical shoulders.
The stop is often placed below the right shoulder. A stop below the head gives the trade more room but requires a smaller position because the potential loss per unit is larger.


3. Ascending Triangle
An ascending triangle forms between horizontal resistance and a rising support line. Repeated tests of the upper level show where sellers are active, while higher lows show that buyers are entering at increasingly higher prices.
The range becomes tighter as pressure builds. A bullish break occurs when price closes above resistance and remains there. TrendSpider defines the pattern through a horizontal upper line and a rising lower line, with the upside break acting as confirmation.
A bullish chart patterns technical analysis trading plan should not enter only because price is close to resistance. Multiple tests can weaken supply, but they can also attract a false break. A close above the level, increased volume, or a successful retest provides better evidence.
The stop may sit below the breakout level, the latest higher low, or the rising line. The chosen location should reflect normal volatility.
4. Bull Flag
A bull flag begins with a sharp upward movement, the flagpole. Price then pauses in a small channel that often slopes downward or moves sideways. The pause allows short-term participants to take profit while the broader trend remains intact.
The setup becomes active when price breaks above the upper boundary. Strong volume on the flagpole, lower volume during consolidation, and renewed activity on the break can support the signal.
A healthy flag usually retraces only part of the initial move. If the pullback becomes deep, lasts too long, or breaks key support, the continuation thesis weakens.
The flagpole can be projected from the breakout as a potential target. This is an estimate, not a promise. Major resistance, funding, and Bitcoin’s direction may limit the move.
5. Bull Pennant
A bull pennant also follows a strong advance, but its consolidation forms a small symmetrical triangle. The upper and lower lines converge while volatility decreases.
The expected signal is a break above the upper line. The best setups usually break before price drifts all the way to the apex. A very late break may show fading momentum rather than stored energy.
The strongest bullish chart patterns technical analysis trading setups combine a clear prior impulse, quieter consolidation, and renewed buying after the break. A stop is often placed below the latest low inside the pennant or below its lower boundary.
A pennant differs from a broad triangle because it is brief and directly followed by a flagpole. A wider symmetrical triangle without a strong first move can break in either direction.


6. Falling Wedge
A falling wedge is formed by two downward-sloping lines that converge as price makes lower highs and lower lows. Despite the downward direction, the contraction suggests that selling strength may be fading.
A bullish signal appears when price breaks above the upper line. The setup is stronger near established support, especially when volume contracts inside the wedge and then increases on the break.
A falling wedge can be a reversal after a decline or a continuation pullback inside an uptrend. This makes location crucial. Oscillators like RSI may add context if price forms a lower low while the indicator forms a higher low, but divergence alone is not an entry.
The stop may sit below the last low or the lower line. Traders should avoid entering before the break merely because the wedge appears complete.
7. Cup and Handle
The cup and handle forms through a rounded decline, a recovery toward the earlier high, and a smaller pullback called the handle. The cup shows a gradual return of buyers; the handle creates a final pause below resistance.
Confirmation occurs when price breaks above the rim or the upper edge of the handle. Fidelity describes the cup with handle as a bullish continuation pattern marked by consolidation followed by a breakout.
This formation often takes more time than a flag or pennant. On high time frames, it can develop across days, weeks, or months. On a small intraday chart, traders should not name every curved movement a cup.
The stop may sit below the handle or nearby support. The cup’s depth can provide a target, but the result should be compared with nearby resistance and current volatility.
How to Confirm a Setup
A visual pattern alone is not enough. The first confirmation is price behavior at the key level. A bullish breakout should close above resistance and show that buyers can keep price there. A wick followed by a close below the level is a warning.
Volume helps assess participation. An increase during the break suggests stronger buying interest. Low volume does not guarantee failure, especially across multiple crypto platforms, but it can reduce confidence.
Market structure is another filter. A reversal is better when price stops making lower lows and starts forming higher lows. A continuation setup is stronger when the main uptrend remains intact.
The broader market also matters. An altcoin signal may fail if Bitcoin breaks major support. A complete bullish chart patterns technical analysis checklist therefore includes context, breakout quality, volume, liquidity, and correlation. TrendSpider also recommends combining patterns with a broader strategy and risk framework.
Breakout Entry or Retest Entry?
A breakout entry opens a position as price moves above confirmation. It captures momentum earlier but faces more false-break risk, wider spreads, and slippage.
A retest entry waits for price to return to the broken level. If former resistance becomes support, the trader receives a clearer invalidation point. The disadvantage is that some strong moves never retest.
| Method | Advantage | Main Risk | Appropriate Conditions |
|---|---|---|---|
| Breakout | Earlier participation. | False break and poor fill. | High liquidity and strong momentum. |
| Retest | Clearer support and tighter stop. | No entry if price keeps rising. | Controlled price action around a key level. |
| Partial entry | Combines both approaches. | More complex management. | Experienced traders with fixed rules. |
The entry method should be chosen before the signal. Changing it during a fast move often leads to emotional decisions.
Stop-Loss and Position Size
A stop belongs where the pattern becomes invalid. For a double bottom, it may be below the second trough. For an ascending triangle, it may be below the latest higher low. For a flag, it may sit below the consolidation.
After the stop distance is known, the trader calculates position size from the amount the account can lose. Risk calculators can help with arithmetic, but they cannot choose the correct technical level.
A sound pattern-trading routine follows this order: define invalidation, calculate size, choose entry, and then place orders. Starting with a desired position often creates excessive risk.
Fees and slippage matter as well. A trade in a liquid Bitcoin market behaves differently from one in a low-volume token with shallow depth.
Setting Targets
Measured-move techniques use the height of a formation. The distance from a double bottom to its neckline can be projected upward. The widest part of a triangle or the flagpole can be used in a similar way.
These are reference points, not guarantees. The market may meet resistance earlier. A better approach compares the measured target with historical levels, volume zones, and recent price action.
Some traders close part of the position at the first resistance and manage the remainder below higher lows. Others use a fixed target. The method should be tested consistently.
If nearby resistance leaves little upside relative to the stop, the pattern may not offer a good trade even if it looks clear.

Crypto-Specific Features
Crypto markets remain open continuously, and liquidity changes across sessions and weekends. A setup formed during active hours may behave differently from one formed in a quiet period.
Exchange data is fragmented. Volume on one platform does not represent the entire market. Comparing spot activity, derivatives data, open interest, and funding can provide additional context.
Leverage can accelerate price movements through liquidation. This may strengthen a breakout or create a sharp move that immediately reverses. Real-time information should support the setup, not replace it.
Social media posts and unexpected news can trigger rapid swings in small assets. Please treat every pattern as a scenario rather than a certainty.
The legal form of a charting provider—corporation or LLC—does not improve a signal. Likewise, tools intended for securities may require adjustment before use in 24/7 crypto markets.
False Breakouts
A false breakout occurs when price crosses resistance but cannot continue and closes back inside the structure. Traders who enter late may become trapped, and their sell orders can strengthen the reverse move.
Warning signs include weak volume, a long upper wick, immediate rejection, or a break directly into a higher-time-frame resistance zone. Thin depth and rapidly widening spreads can also distort the chart.
Pattern analysis cannot remove false signals. It provides a way to define when the expected action has failed.
Once price violates the planned structure, the trader should not widen the stop simply because the formation still has a bullish name.
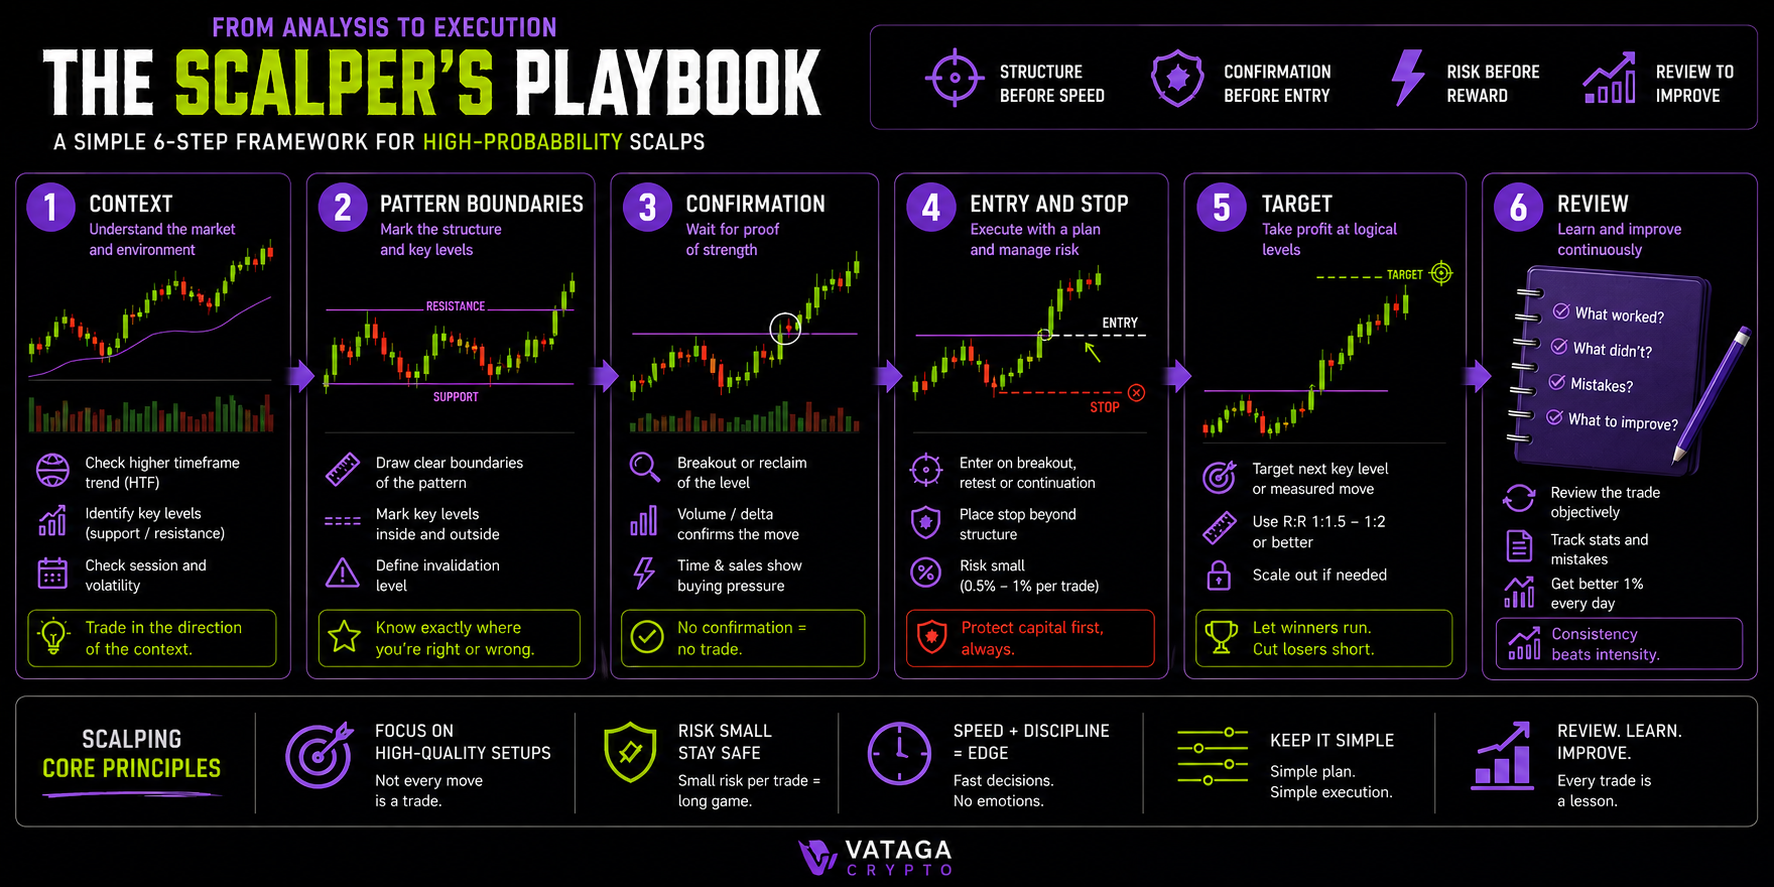
Practical Workflow
| Stage | Action | Decision |
|---|---|---|
| Context | Identify trend, range, support, and resistance. | Is a bullish setup logical here? |
| Pattern | Draw boundaries and confirmation level. | Is the structure clear? |
| Confirmation | Check close, volume, momentum, and Bitcoin. | Did buyers take control? |
| Risk | Mark invalidation and calculate size. | Is the potential loss acceptable? |
| Target | Compare projection with resistance. | Is there enough upside? |
| Execution | Enter on break, retest, or partial plan. | Are spread and liquidity acceptable? |
| Review | Save the chart and record performance. | Were the rules followed? |
This bullish chart patterns technical analysis trading workflow is intended to reduce impulsive entries. It also creates comparable historical data for research and better decision-making.
Common Mistakes
The first mistake is naming a pattern before enough price action has formed. Two lows are not a completed double bottom until the neckline breaks.
The second is ignoring the earlier trend. Reversal structures require a meaningful decline, while continuation structures require an established upward move.
The third is entering directly below major resistance. A small pattern may break but still have limited upside.
The fourth is treating multiple technical indicators as independent votes. Several oscillators based on the same prices can create the appearance of accuracy without improving the strategy.
The fifth is reviewing only successful charts. Better analysis includes failed patterns, skipped trades, and different market conditions. Performance must be measured across many examples.
Finally, traders often focus on predicting direction and forget risk. A clear setup with poor sizing can cause a significant loss.
How to Practice
Start with one or two pattern types. Mark them on historical charts without looking at what happened next. Write down the confirmation line, stop, and target.
Then move through the chart bar by bar. This prevents hindsight from making every setup appear obvious. Compare the same rules across different assets, time frames, and trends.
Use charting tools to save examples and a journal to track trades. The goal is not to become fast at naming patterns. It is to become consistent at accepting complete setups and rejecting incomplete ones.
A final trading journal should record context, entry quality, stop placement, costs, and whether the plan was followed.
Final Checklist and Summary
Before entering, confirm the pattern’s location, key level, volume, liquidity, and broader direction. Make sure the stop marks true invalidation and the target offers adequate reward.
Bullish chart patterns technical analysis helps organize price movements, but it does not guarantee future results. Reversal forms show where selling may weaken; continuation forms show where an uptrend may resume after a pause.
The method works best when a trader combines structure, support and resistance, volume, momentum, and strict risk control. The chart provides a visual guide, while execution and position management determine the actual result.
This approach is not a collection of drawings to memorize. It is an approach for creating clear scenarios, testing them against market behavior, and making disciplined decisions.